Blood pressure data display method

A data display and blood pressure technology, applied in vascular assessment, cardiac catheterization, etc., can solve difficult problems such as blood pressure status and significance, and achieve the effect of easy viewing and operation

Active Publication Date: 2011-05-18
北京爱和健康科技有限公司
View PDF4 Cites 7 Cited by
  • Summary
  • Abstract
  • Description
  • Claims
  • Application Information

AI Technical Summary

Problems solved by technology

Most of the sphygmomanometers currently on the market display the current measurement data after the measurement, and press the memory key to read the histori

Method used


Image

  • Blood pressure data display method
  • Blood pressure data display method
  • Blood pressure data display method

Examples


Embodiment Construction

[0021] The present invention will be described in detail below in conjunction with the accompanying drawings and specific embodiments.

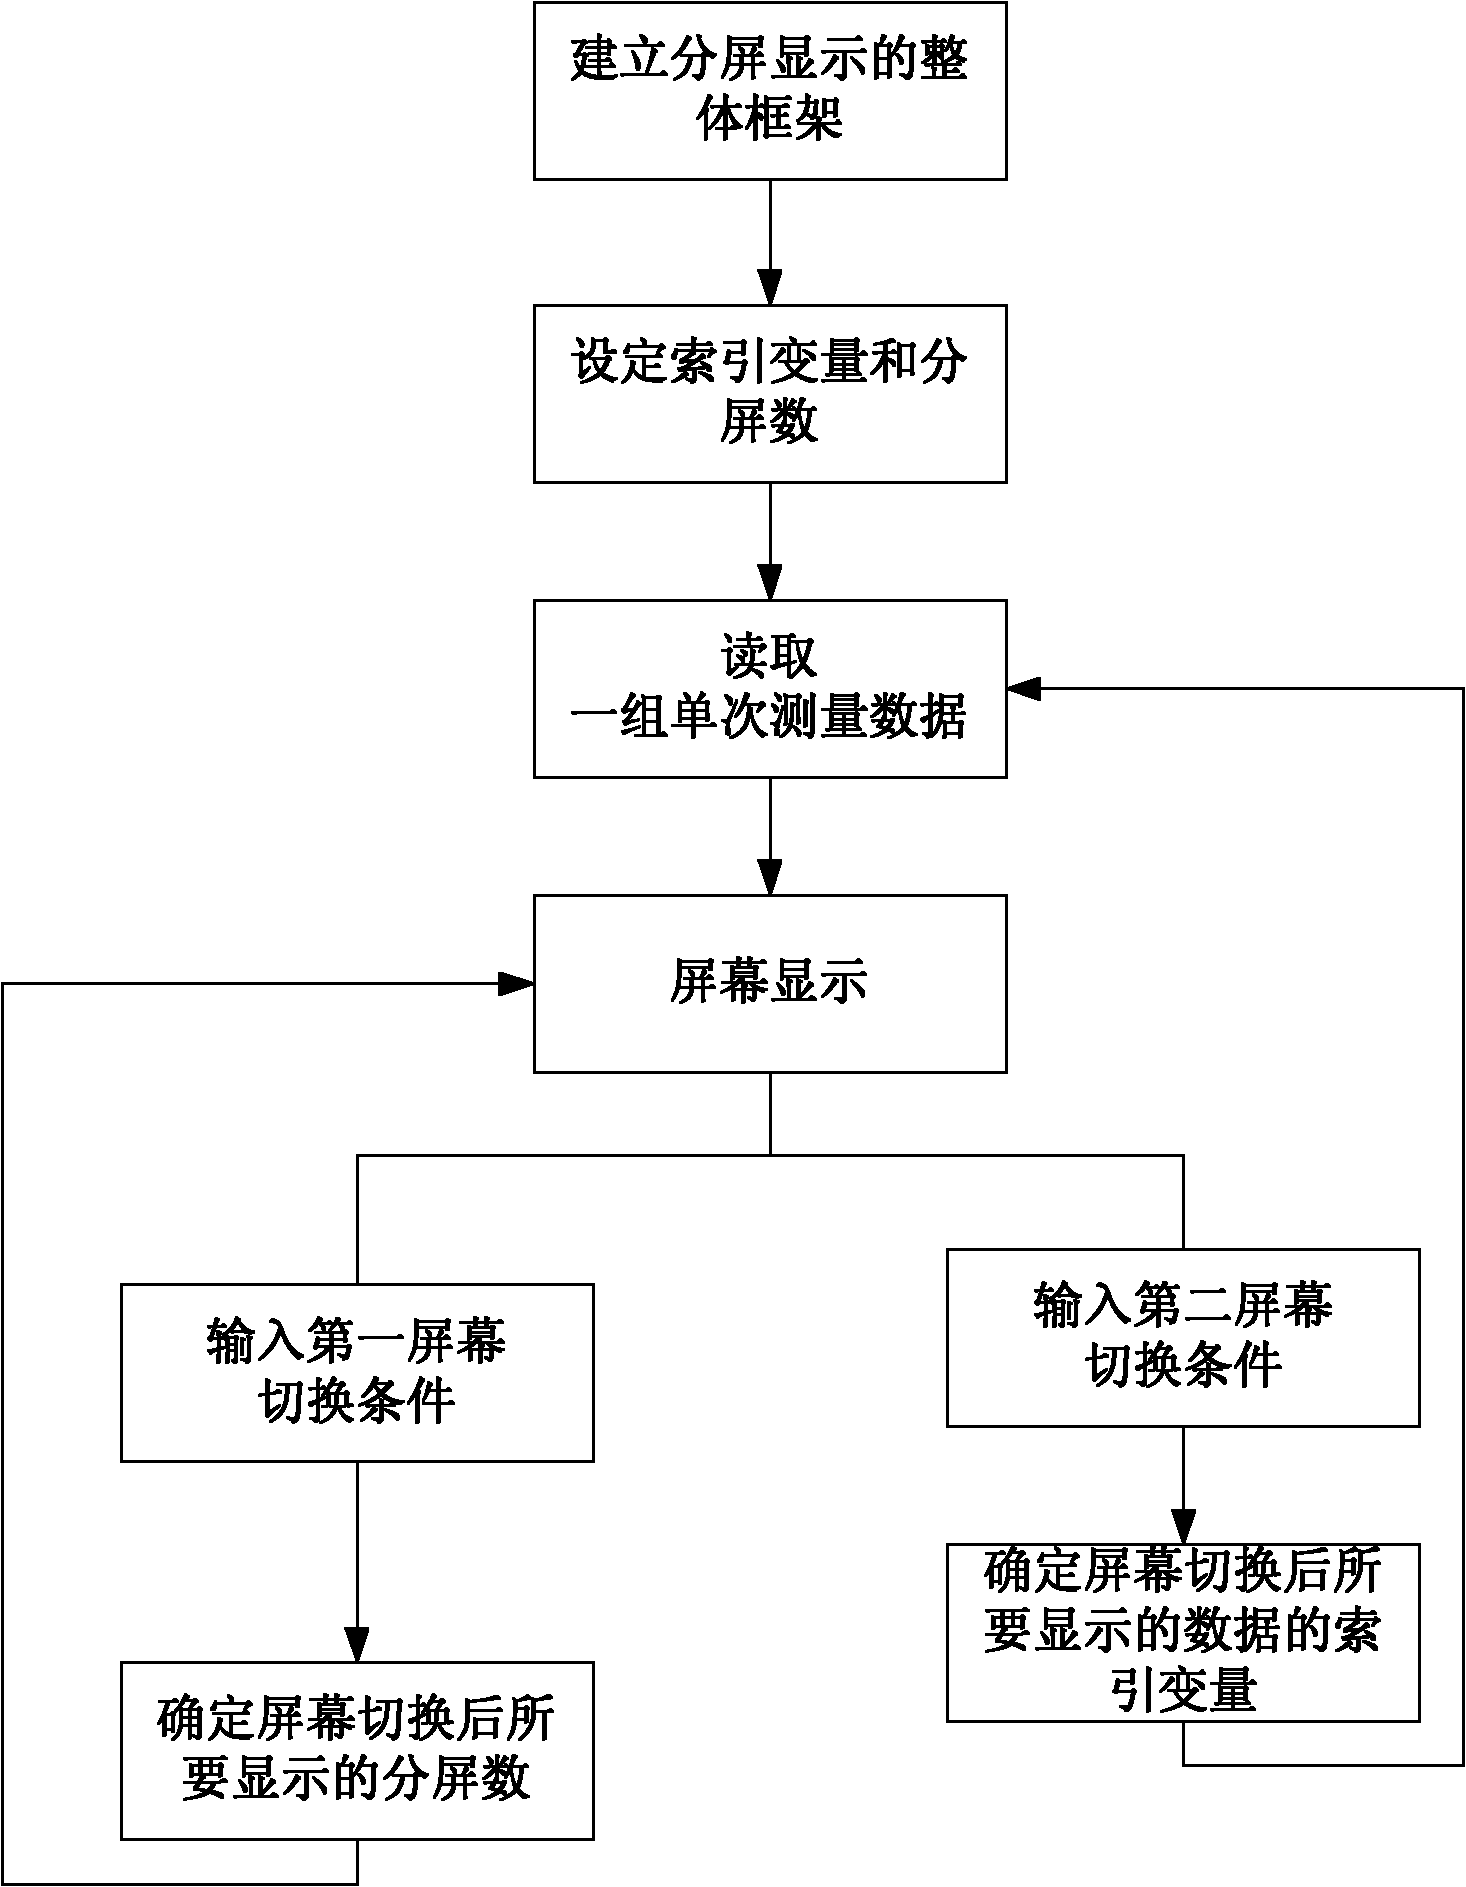
[0022] The blood pressure data display method of the present invention can be applied to a variety of devices with a CPU such as a sphygmomanometer, a mobile phone, and a palmtop computer. If the device is a sphygmomanometer itself, data related to blood pressure can be obtained through the machine; if it is a mobile phone, a handheld computer, etc., the measurement data can be obtained from other devices through wired, wireless communication, or a USB interface. see figure 1 , the device used in the display method of the present invention should at least include a data storage unit, an operation unit, a data processing unit, and a data display unit. Each group of measurement data related to blood pressure is stored in the data storage unit, and each group of measurement data is A group of single measurement data, each group of measurement d...


PUM


Abstract

The invention relates to a blood pressure data display method which comprises the steps of: 1, establishing an integral frame of each split screen when in split display; 2, setting an index variable of single measurement data to be displayed, setting split screen quantity to be displayed; 3, reading one group of single measurement data; 4, carrying out screen display on blood pressure data according to the split screen quantity to be displayed and the read single measurement data; and 5, inputting screen switching conditions by using an operating unit, wherein the screen switching condition is one of the following two: a first screen switching condition for displaying certain split screen quantity and a second screen switching condition for displaying certain group of historical measurement data; if the first screen switching condition is input, the split screen quantity to be displayed after the screen is switched is determined according to the switching condition and the step 4 is returned, if the second screen switching condition is input, the index variable of the single measurement to be displayed after the screen is switched is determined according to the switching condition, and the step 3 is returned. The display method provided by the invention can be used for visually displaying the single measurement data and provides a more convenient mode for looking up the historical data by the user.

Description

technical field [0001] The invention relates to a method for displaying blood pressure data, in particular to a method for displaying blood pressure data which is convenient for users to operate and understand. Background technique [0002] With the improvement of people's living standards, people pay more and more attention to their health. Sphygmomanometers have become a part of modern people's lives, and more and more have entered the daily lives of ordinary people. Most of the sphygmomanometers currently on the market display the current measurement data after the measurement, and press the memory key to read the historical measurement data. It is difficult for people to vividly understand the specific blood pressure status and significance represented by the displayed values. Therefore, it is an urgent need for users of sphygmomanometers to provide a display method that can be intuitively displayed, is easy to understand, adapts to various ways of thinking of various ...

Claims


Application Information

Patent Timeline
IPC IPC(8): A61B5/021
Inventor 刘毅李超
Owner 北京爱和健康科技有限公司
Why Eureka
Try Eureka