Holographic natural K-line mathematical model and applications thereof to securities technology analysis

A technology of technical analysis and mathematical model, applied in the field of technical analysis of stocks and securities, it can solve the problems of the ambiguity of the K-line chart, the too large or too small range of entity definition, and the inability to comprehensively and scientifically reflect the close relationship of stocks, so as to avoid ambiguity. sexual effect

Inactive Publication Date: 2011-06-01
戴家勇
View PDF0 Cites 7 Cited by
  • Summary
  • Abstract
  • Description
  • Claims
  • Application Information

AI Technical Summary

Problems solved by technology

[0006] 1. The definition of the rising or falling nature of the yin and yang candlestick K line is only based on today’s opening price, which makes the yin and yang nature of the K line ambiguous;
[0007] 2. When the length of the K-line entity of the Yin-Yang candlestick gaps and opens low or opens high, the definition range of the entity is obviously too large or too small;
[0008] 3. The definition range of the size of the candlestick K-line gap is too narrow, including only pure vacuum gaps;
[0009] 4. The upper and lower shadow lines of the K-line of the yin and yang candlesticks cannot accurately reflect the real game situation of the strength of the long and short sides;
[0010] 5. The relationship between today's and yesterday's K-lines in the Yin-Yang candlestick K-line is relatively loose, and the correlation is not close enough
[0013] (3) When the stock price opens lower today but closes slightly higher than yesterday’s closing price, the large positive body of the K-line cannot truly reflect the slight change in today’s closing price relative to yesterday’s closing price;
[0014] (4) When the stock price opened higher today but closed slightly lower than yesterday's closing price, the large Yin line entity of the K-line cannot truly reflect the slight change in today's closing price relative to yesterday's closing price;
[0015] (5) The stock price opened higher and closed higher today. The body of the positive K-line is too small to accurately reflect the large change relative to yesterday's closing price;
[0016] (6) The stock price opened lower and closed lower today. The body of the Yin K-line is too small to accurately reflect the large change from yesterday's closing price;
[0020] Therefore, the traditional yin and yang candlestick chart technical indicators cannot fully, correctly and accurately reflect the internal real situation and results of the daily power game between long and short sides of the stock price, and at the same time cannot fully and scientifically reflect today's stock price and Close link to yesterday's price
[0021] Therefore, when the technical analysis of the operation changes of the stock price trend is carried out based on the traditional yin and yang candlestick K-line chart technical indicators, the K-line chart has obvious ambiguity and looseness (the connection between consecutive days is not close. nature) and misleading, making it difficult for investors to correctly and deeply interpret the real internal change process and natural results of the daily stock price game, and it is easy to cause errors in analysis and judgment, and may cause investment operation errors, resulting in investment losses

Method used


Image

  • Holographic natural K-line mathematical model and applications thereof to securities technology analysis
  • Holographic natural K-line mathematical model and applications thereof to securities technology analysis
  • Holographic natural K-line mathematical model and applications thereof to securities technology analysis

Examples


Embodiment Construction

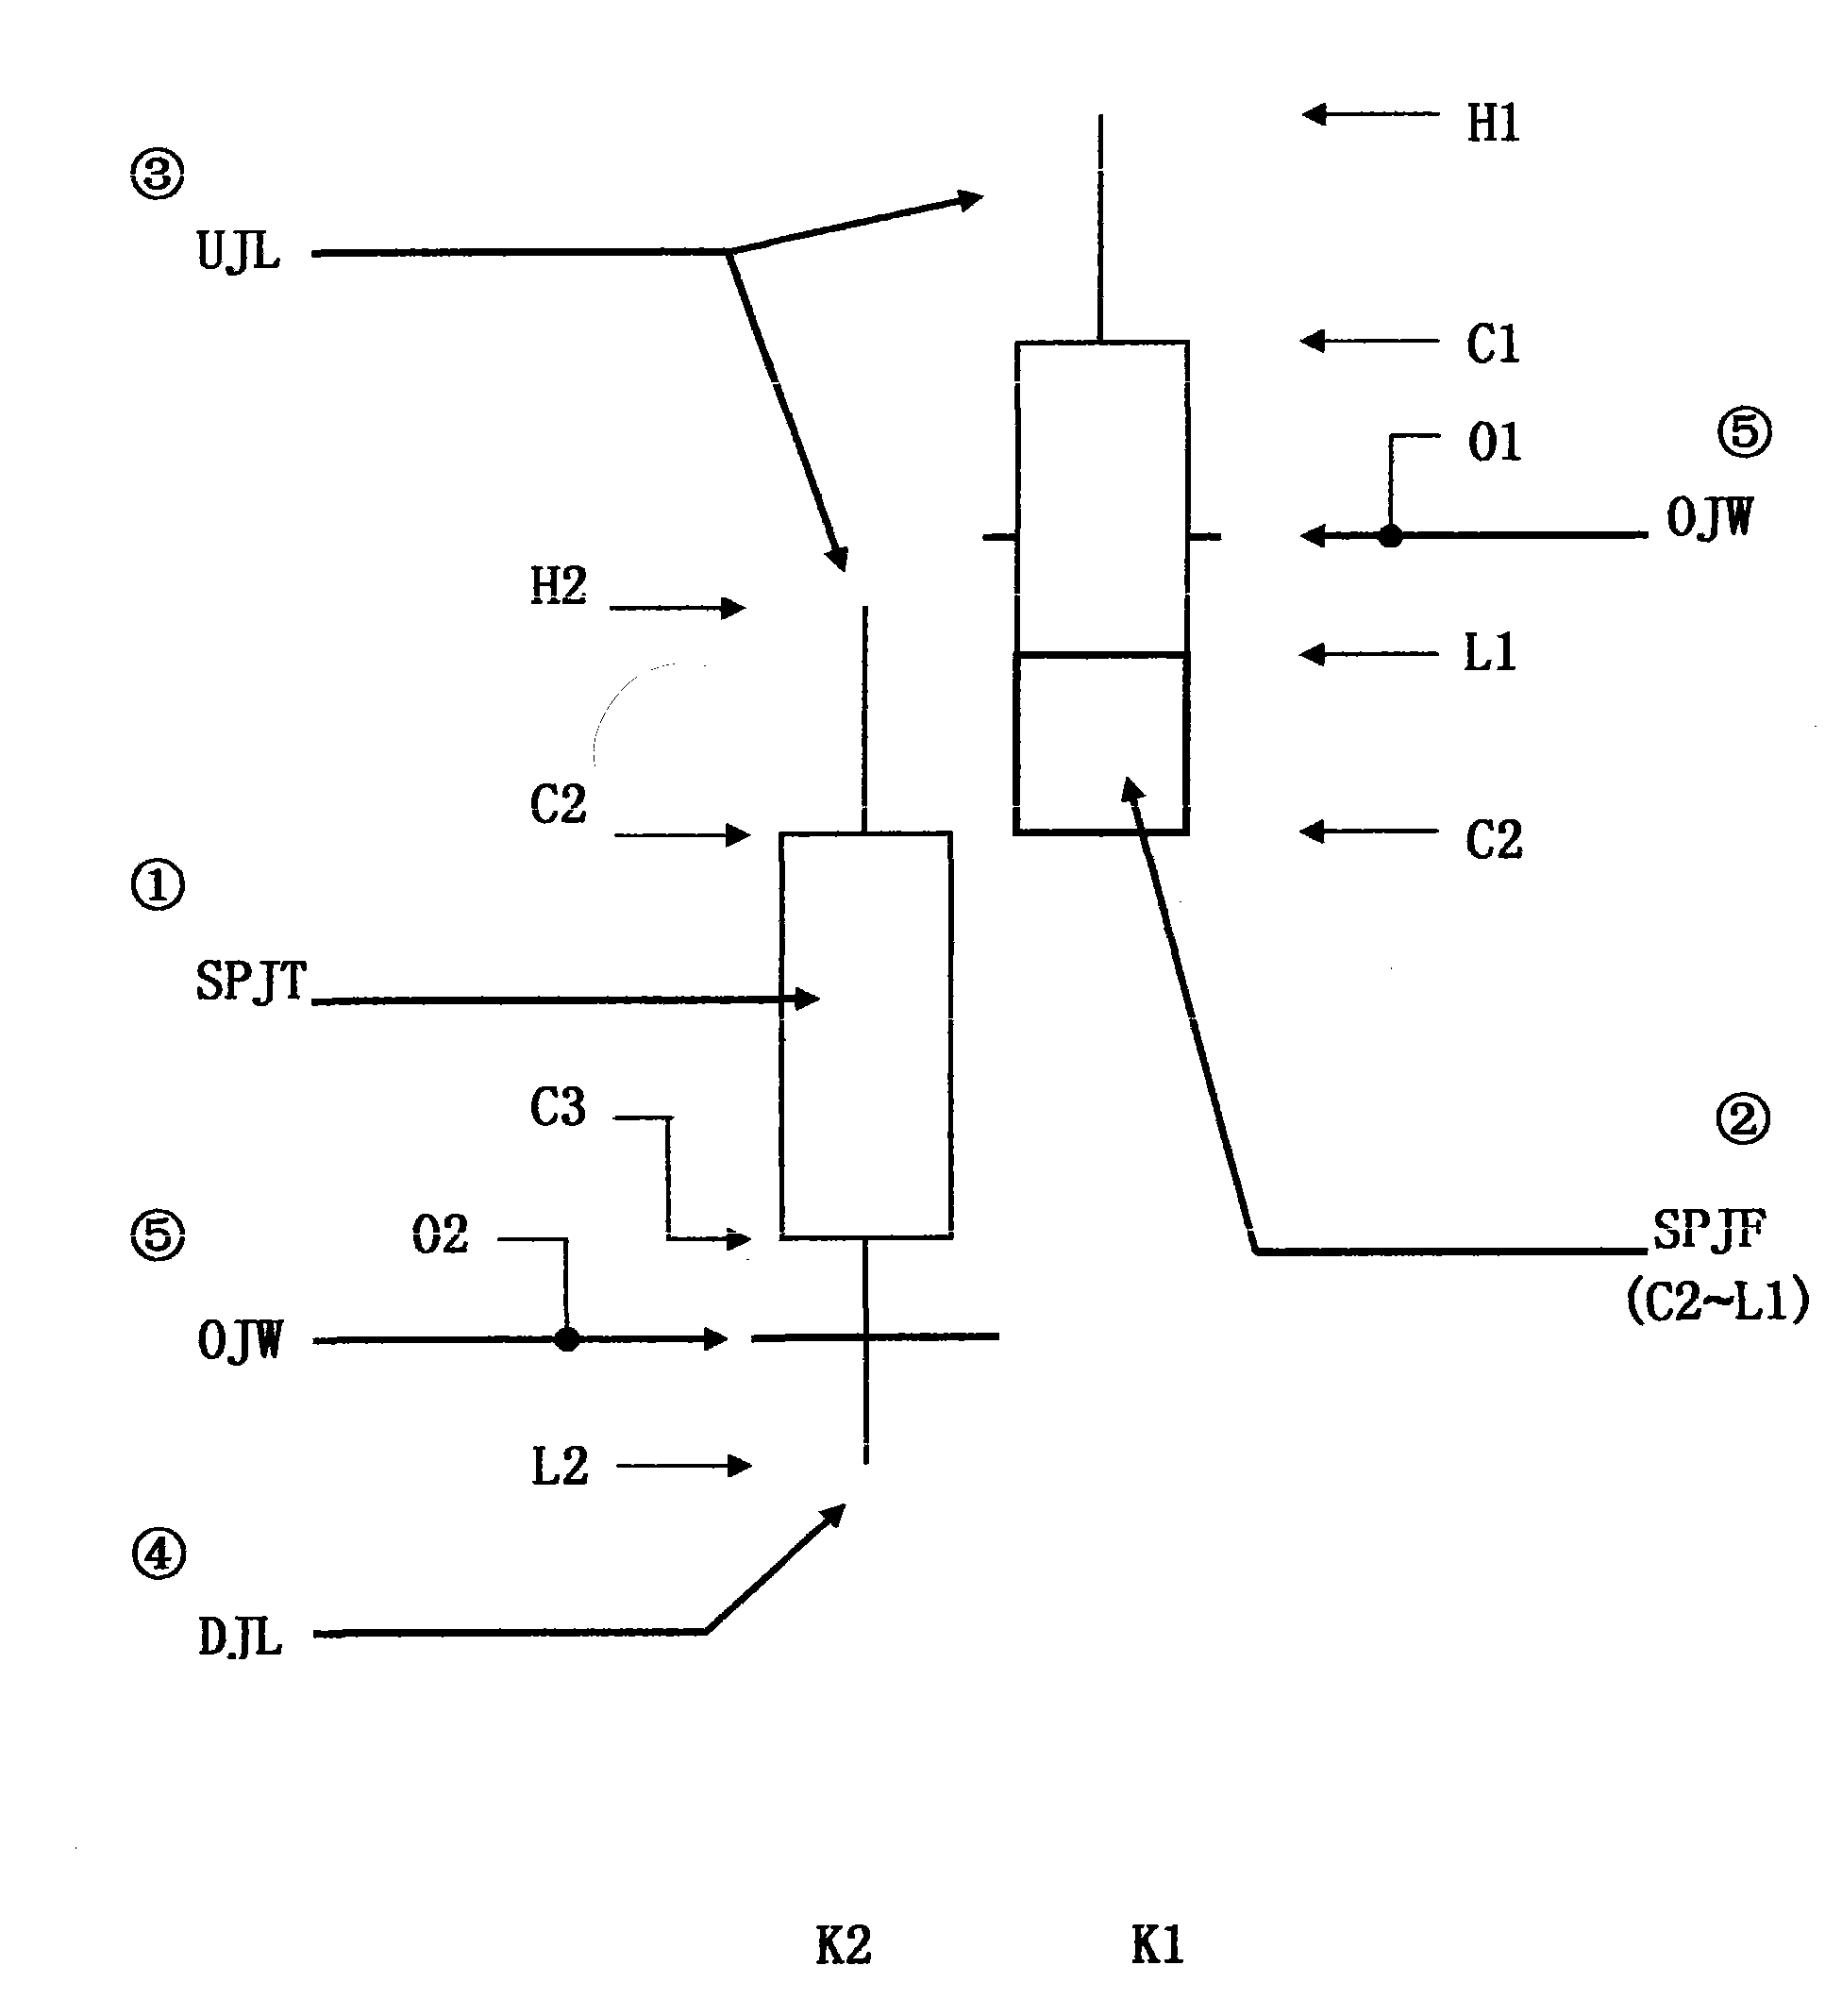
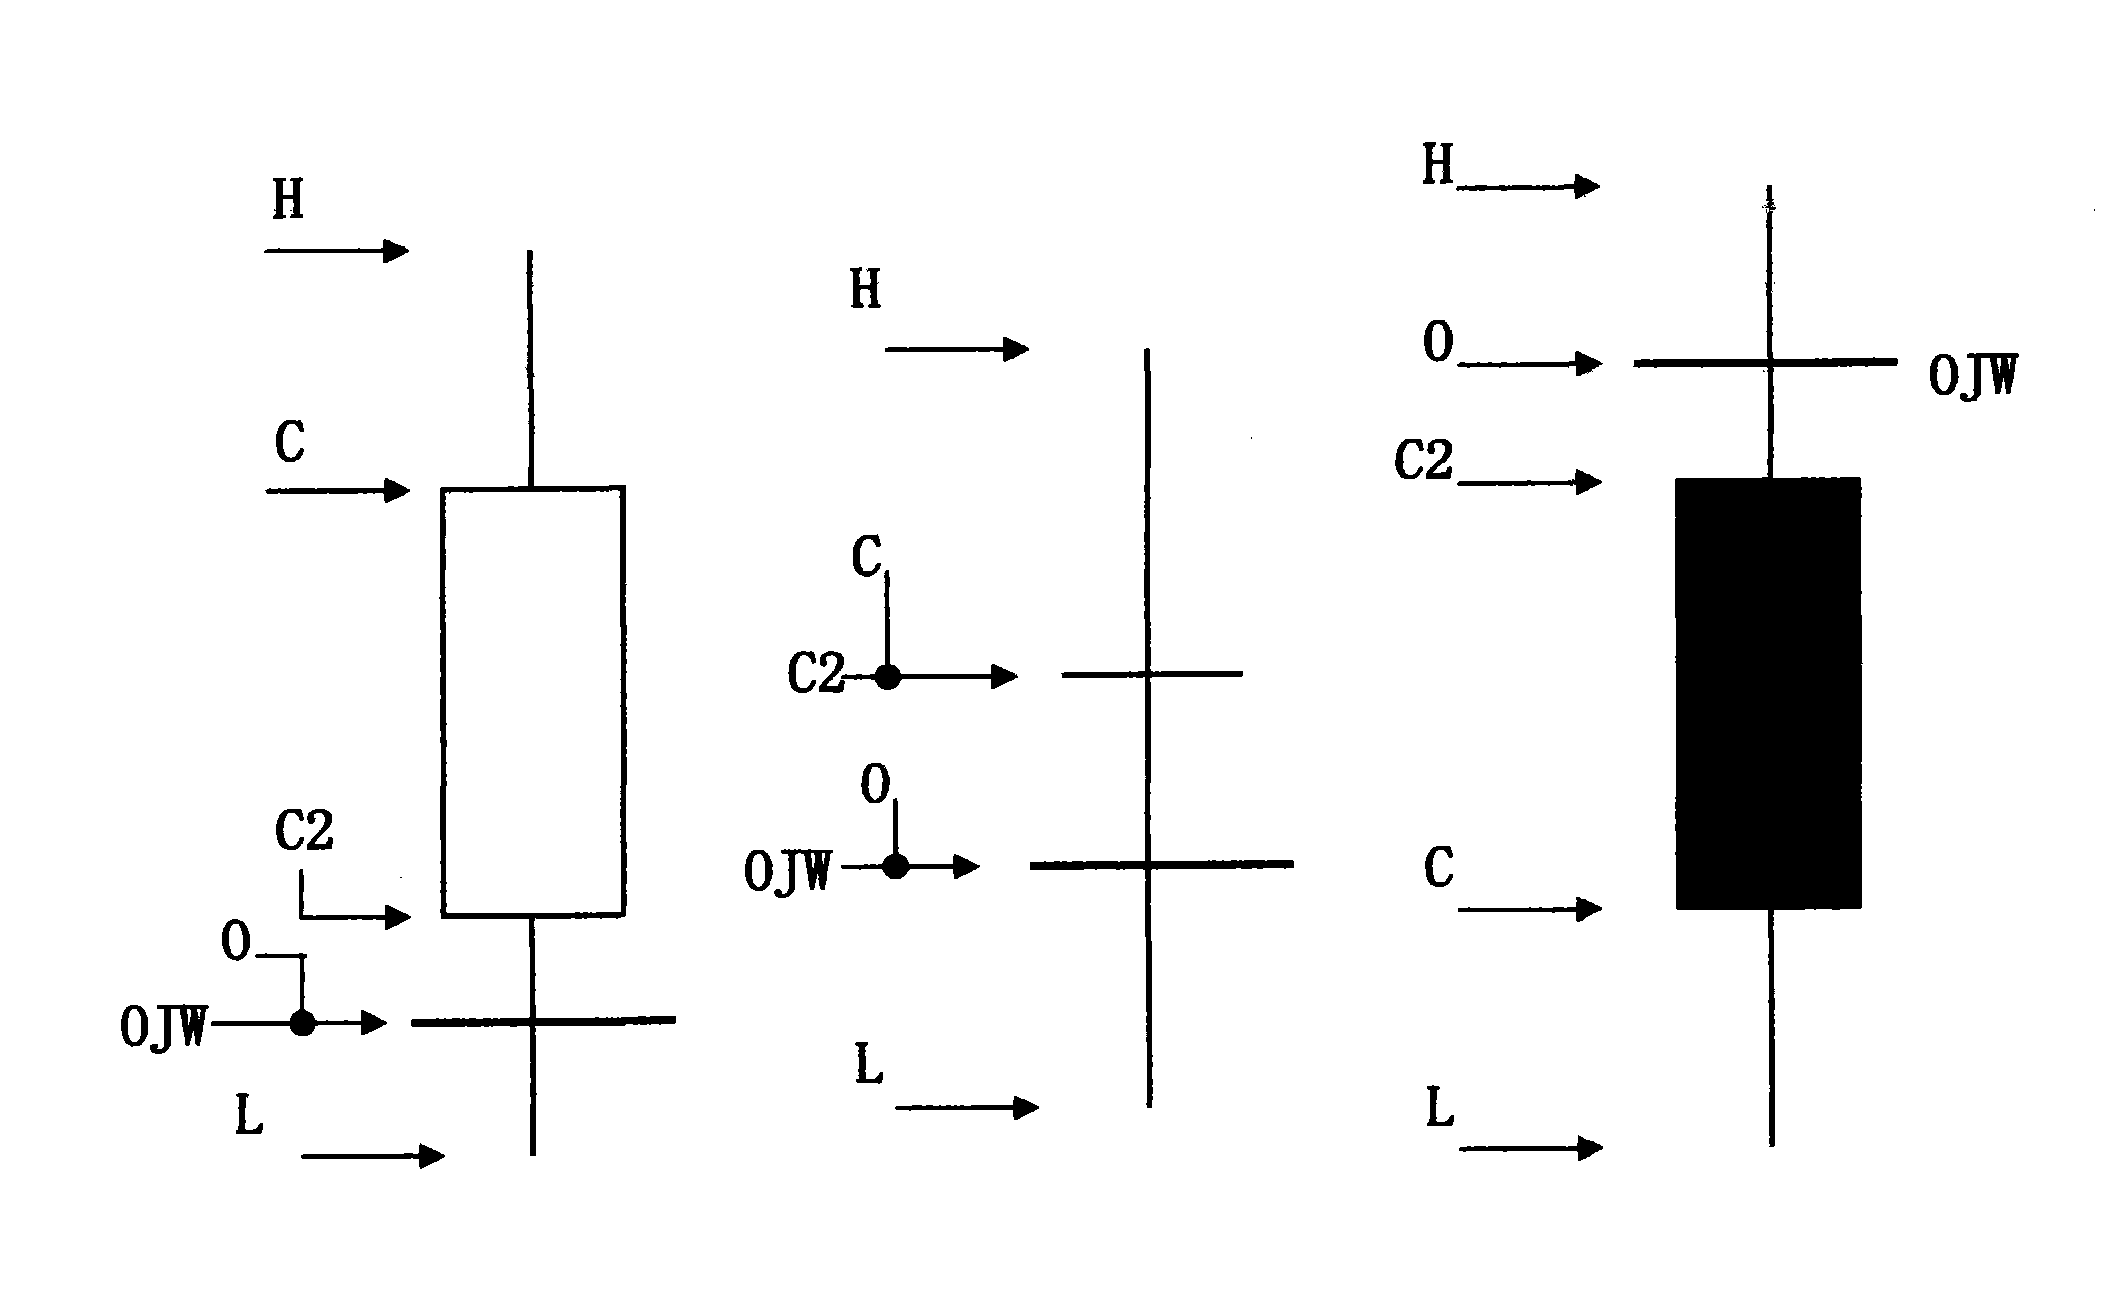
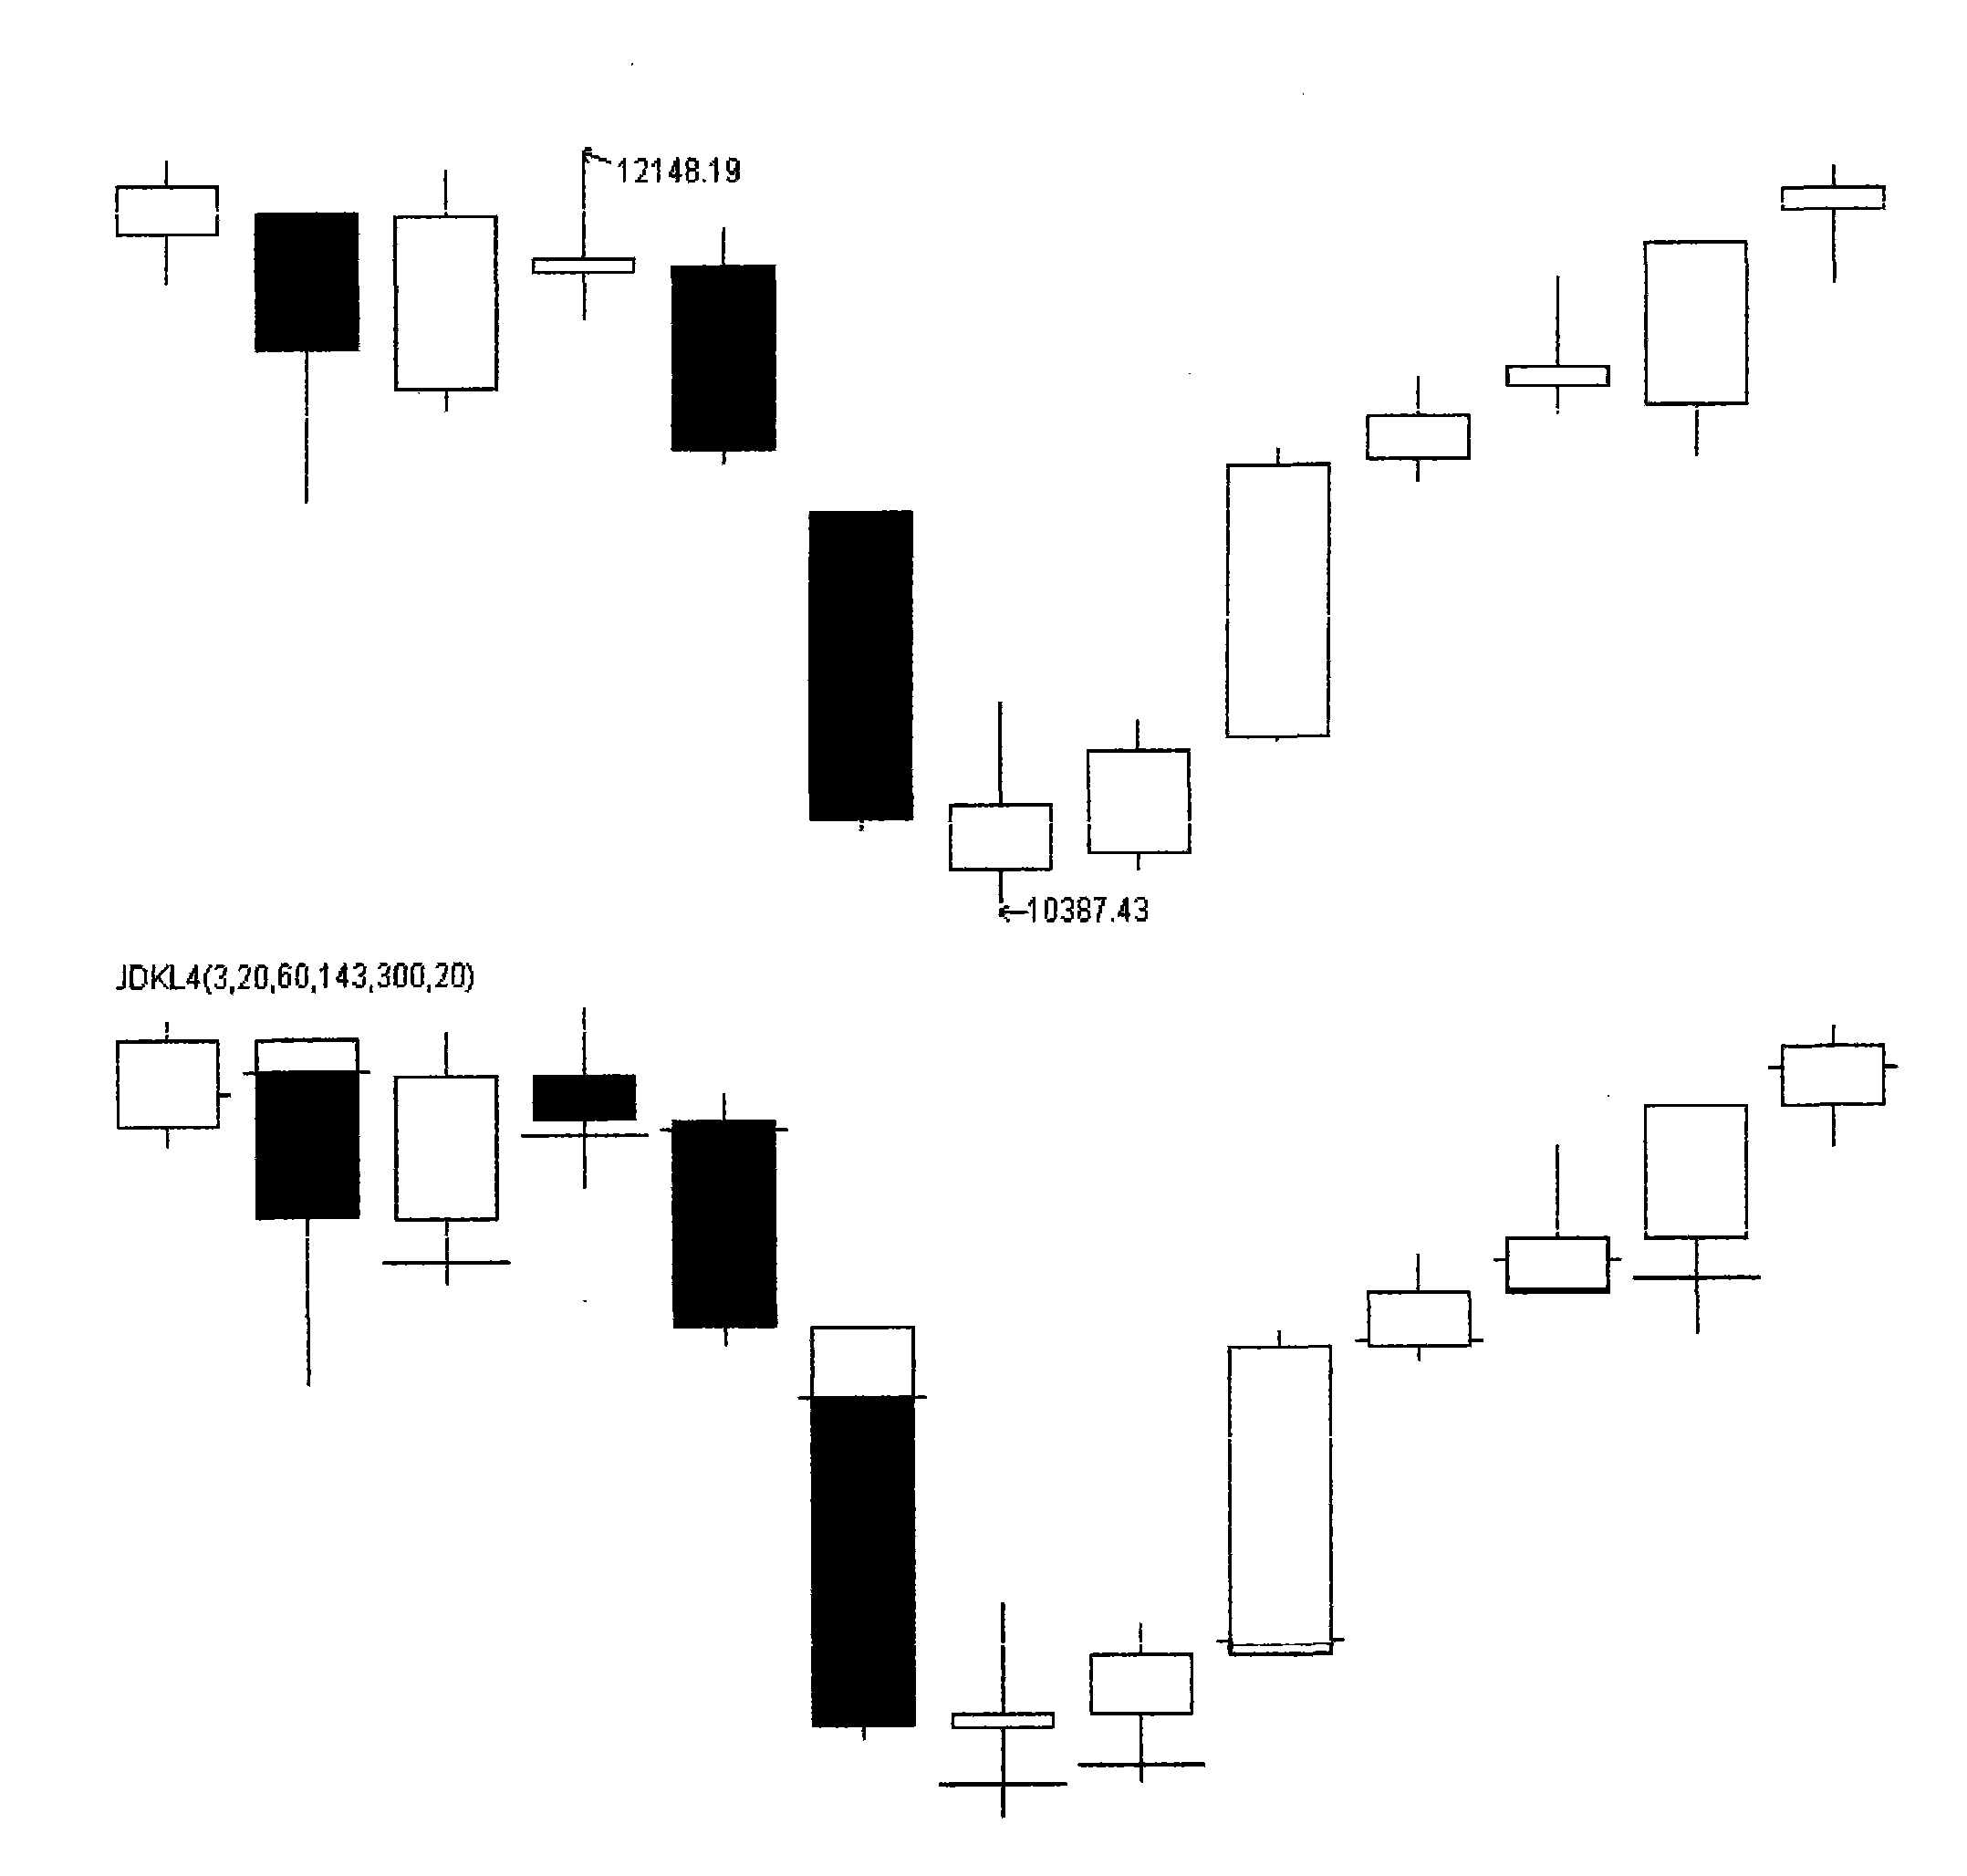
[0264] 1. The application of the holographic natural K-line mathematical model in the technical analysis of stocks and securities is mainly carried out through the technical index of the holographic natural K-line expressed in the form of Yin-Yang K-line graphics.

[0265] (1) see Figure 5 , through the programming language of the stock technical analysis software, the mathematical model of the holographic natural K-line is expressed with the graphic technical indicators of the Yin-Yang K-line, forming a new type of holographic natural K-line, which constitutes a new type of stock price line, and Become the core stock price technical indicator in the stock securities technical analysis software;

[0266] (2) This will constitute a new type of independent technical analysis theory and method, which can be used independently or combined with other technical indicators and technical methods to comprehensively apply to the in-depth analysis, research and judgment of the price flu...


PUM


Abstract

The invention relates to the field of stock securities technology analysis, and in particular discloses a holographic natural k-line mathematical model and a graphic technological index thereof. The invention has relative stability and contact closeness by using the yesterday closing price of the stock as a comparison reference, is a scientific stock price change calculation presentation method according with the natural objective rule and people's traditional cultural ideology and living thoughts and habits, scientifically defines and sorts the K-line candle stick properties relative to the yesterday closing price and accurately discloses and reflects the natural results of the game process among short sellers and the force comparison change. The invention solves and overcomes the congenital defects of fuzziness, looseness and misleading properties existing in a traditional candle stick K-line using an opening price as a reference, expands the K-line contents and theory and has richer information, simpler and vivid graphs, stronger stereoperception and easiness of study, grasp, operation and use. The invention provides scientific core stock price graph index and important basis for the stock technology analysis and is widely suitable for being used in the stock technology analysis and transactions of stocks, futures, and the like.

Description

technical field [0001] The invention relates to the technical analysis field of stock securities, in particular to a holographic natural K-line mathematical model and an application method of a new graphic technical index of the holographic natural K-line expressed in the form of Yin-Yang K-line in the technical analysis field of stock securities. Background technique [0002] In the existing technical analysis of stock securities, the stock price line is an important curve describing the stock price trend. It is the core and foundation of all stock technical analysis, and it constitutes the most commonly used main chart core index of stock technical analysis software. [0003] In the existing traditional stock technical analysis, the stock price line includes the closing price line (CLOSE), the closing station line (SCLOSE), the pagoda line (MTOW), the American line (BAR) originated in the United States, and the yin and yang candlestick originated in Japan. There are 5 type...

Claims


Application Information

Patent Timeline
Patent Type & Authority Applications(China)
IPC IPC(8): G06Q40/00
CPCG06Q40/04G06Q40/06
Inventor 戴家勇
Owner 戴家勇
Why Eureka
Try Eureka