Visualized method, visualized device and visualized system for indoor testing data

A technology for testing data and data, applied in electrical components, wireless communication, network planning, etc., can solve problems such as increased workload, no latitude and longitude, and no support for visualization

Inactive Publication Date: 2011-09-14
ZTE CORP
View PDF3 Cites 14 Cited by
  • Summary
  • Abstract
  • Description
  • Claims
  • Application Information

AI Technical Summary

Problems solved by technology

For the test data without manually recording the latitude and longitude when there is no test, the existing drive test analysis software does not support visualization
Since manual recording of latitude and longitude is cumbersome and increases the workload, most of the indoor test data in actual work are without latitude and longitude

Method used


Image

  • Visualized method, visualized device and visualized system for indoor testing data
  • Visualized method, visualized device and visualized system for indoor testing data
  • Visualized method, visualized device and visualized system for indoor testing data

Examples


Embodiment Construction

[0032] In order to make the technical problems, technical solutions and beneficial effects to be solved by the present invention clearer and clearer, the present invention will be further described in detail below in conjunction with the accompanying drawings and embodiments. It should be understood that the specific embodiments described here are only used to explain the present invention, not to limit the present invention.

[0033] The present invention proposes a visualization method based on time sequence, which is suitable for any indoor test data, and does not require the indoor floor plan of the building, nor does the tester manually mark the location during the test, so that the indoor test of the wireless network can be visually analyzed data, thereby helping wireless network optimization engineers improve work efficiency.

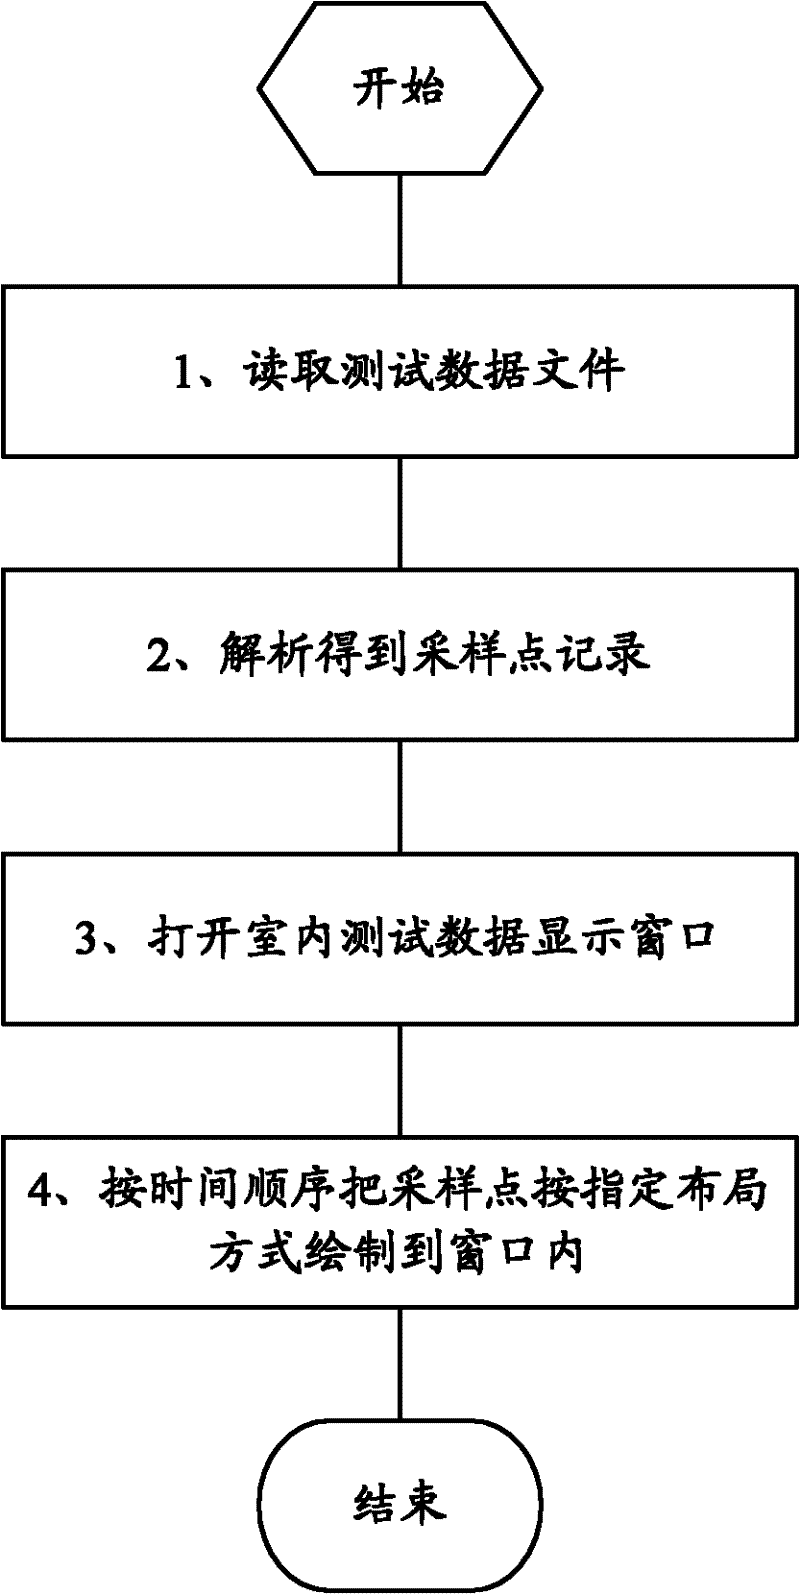
[0034] Such as figure 1 As shown, the implementation of the present invention provides a method for visualizing indoor test data, and the speci...


PUM


Abstract

The invention provides a visualized method for indoor testing data, comprising the following steps of step 1: reading a testing data file; step 2: analyzing the testing data file, thus obtaining the sampling point records; step 3: opening a displaying window of indoor testing data; step 4: drawing the sampling point data in the window according to the time sequence. The invention also provides a visualized device and a visualized system for indoor testing data. By adopting the method, the device and the system, the indoor testing data of a wireless network can be analyzed by a more intuitive visualized way, thus helping a wireless network optimization engineer to know more detailed network information, thereby improving the working efficiency.

Description

technical field [0001] The invention relates to a technical method for wireless network planning and optimization, in particular to a method, device and system for visualization of indoor test data. Background technique [0002] In wireless network planning and optimization, testing the wireless network is a basic means to evaluate the quality of the wireless network. Tests include Drive Test (Drive Test) and CQT (Call Quality Test) two types. Drive testing refers to using test equipment to make different types of calls along a specified route. CQT refers to the use of test equipment in a specific location to conduct a certain scale of dial testing. Through drive test and CQT, users can simulate the process of using the network, obtain the wireless parameters received by the mobile phone and the events and messages during the call, so as to analyze and evaluate the quality of the network and locate network faults. [0003] At present, in the industry, for outdoor tests (i...

Claims


Application Information

Patent Timeline
Patent Type & Authority Applications(China)
IPC IPC(8): H04W16/18H04W24/02
Inventor 陈前华朱振明庞德李敏黄河
Owner ZTE CORP
Why Eureka
Try Eureka