
Method for optimizing display data

A data and data import technology, applied in the direction of electrical digital data processing, special data processing applications, instruments, etc., can solve the problems of smaller display spacing, unclear interface, black image, etc., to achieve convenient application and optimize display data Effect

Inactive Publication Date: 2013-10-09
SHENZHEN ARTEL TECH
View PDF2 Cites 6 Cited by
  • Summary
  • Abstract
  • Description
  • Claims
  • Application Information

AI Technical Summary

Problems solved by technology

When displaying less data, the data can be displayed normally on the drawing interface; when the data is larger than a certain amount, the display spacing of the data will become smaller or even turn the image into black, affecting the user experience
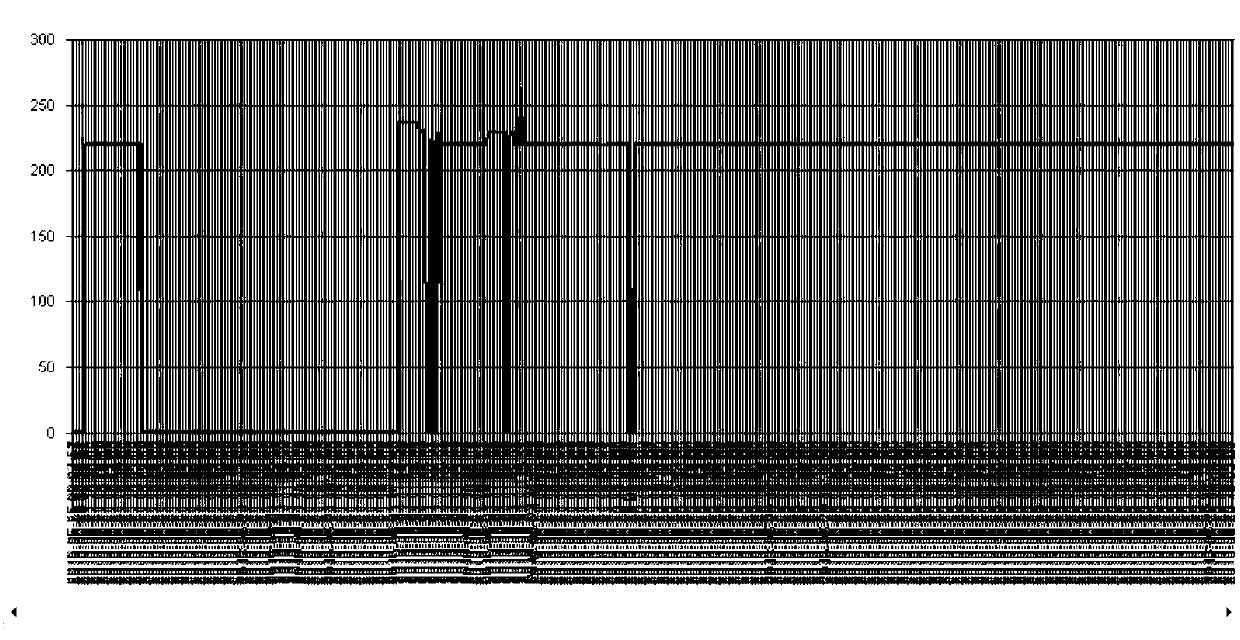
For example, the maximum width of the Mschart control is 245745. If there is a lot of data displayed, the width of the data will be greater than the maximum width of the Mschart control under the condition that it is clearly and correctly displayed. At this time, when the above data are displayed in the drawing interface at the same time, it will cause Situations where the interface cannot be seen clearly

Method used


Image

  • Method for optimizing display data
  • Method for optimizing display data
  • Method for optimizing display data

Examples


Embodiment Construction

[0024] The specific embodiment of the present invention will be further described below with reference to accompanying drawing:

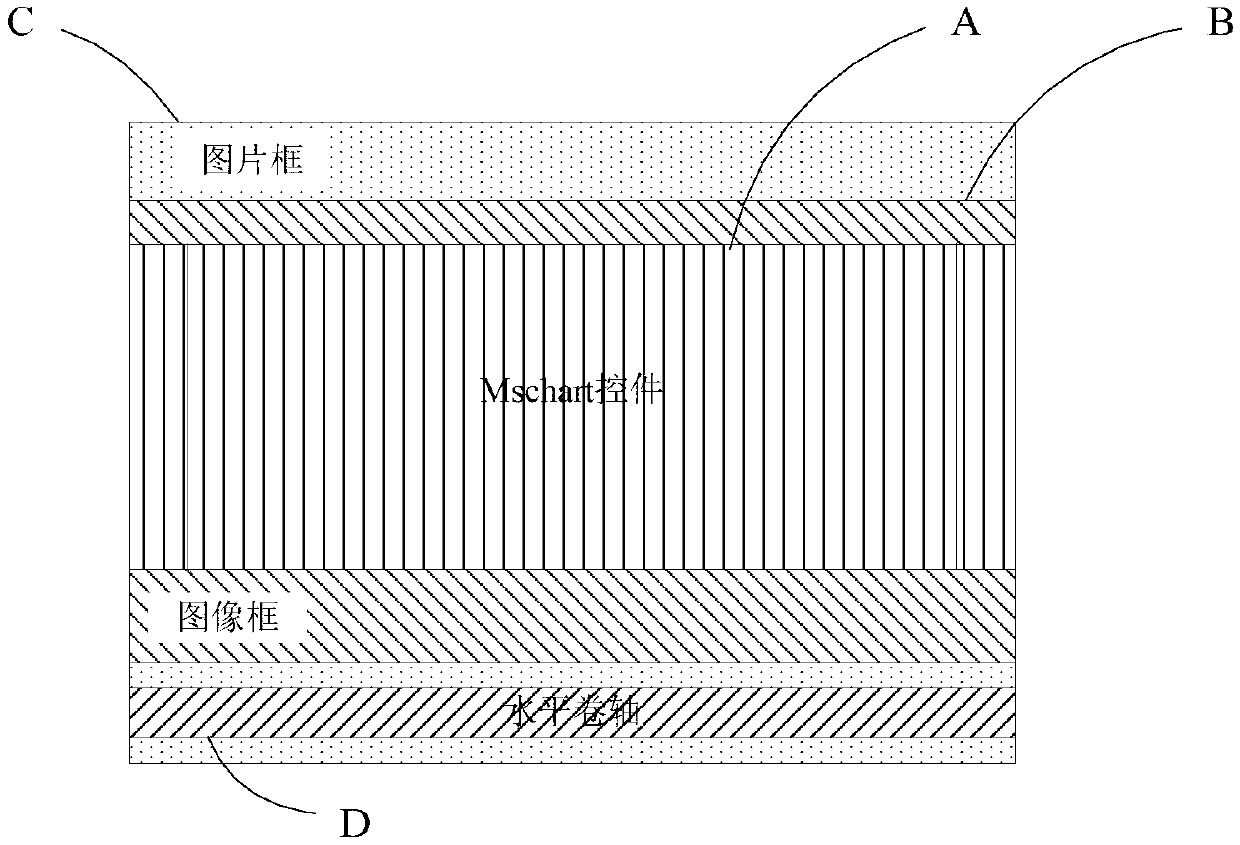
[0025] Such as figure 1 As shown, the embodiment according to the present invention involves Mschart control A, image frame B, picture frame C and horizontal scroll D in VB6.0.

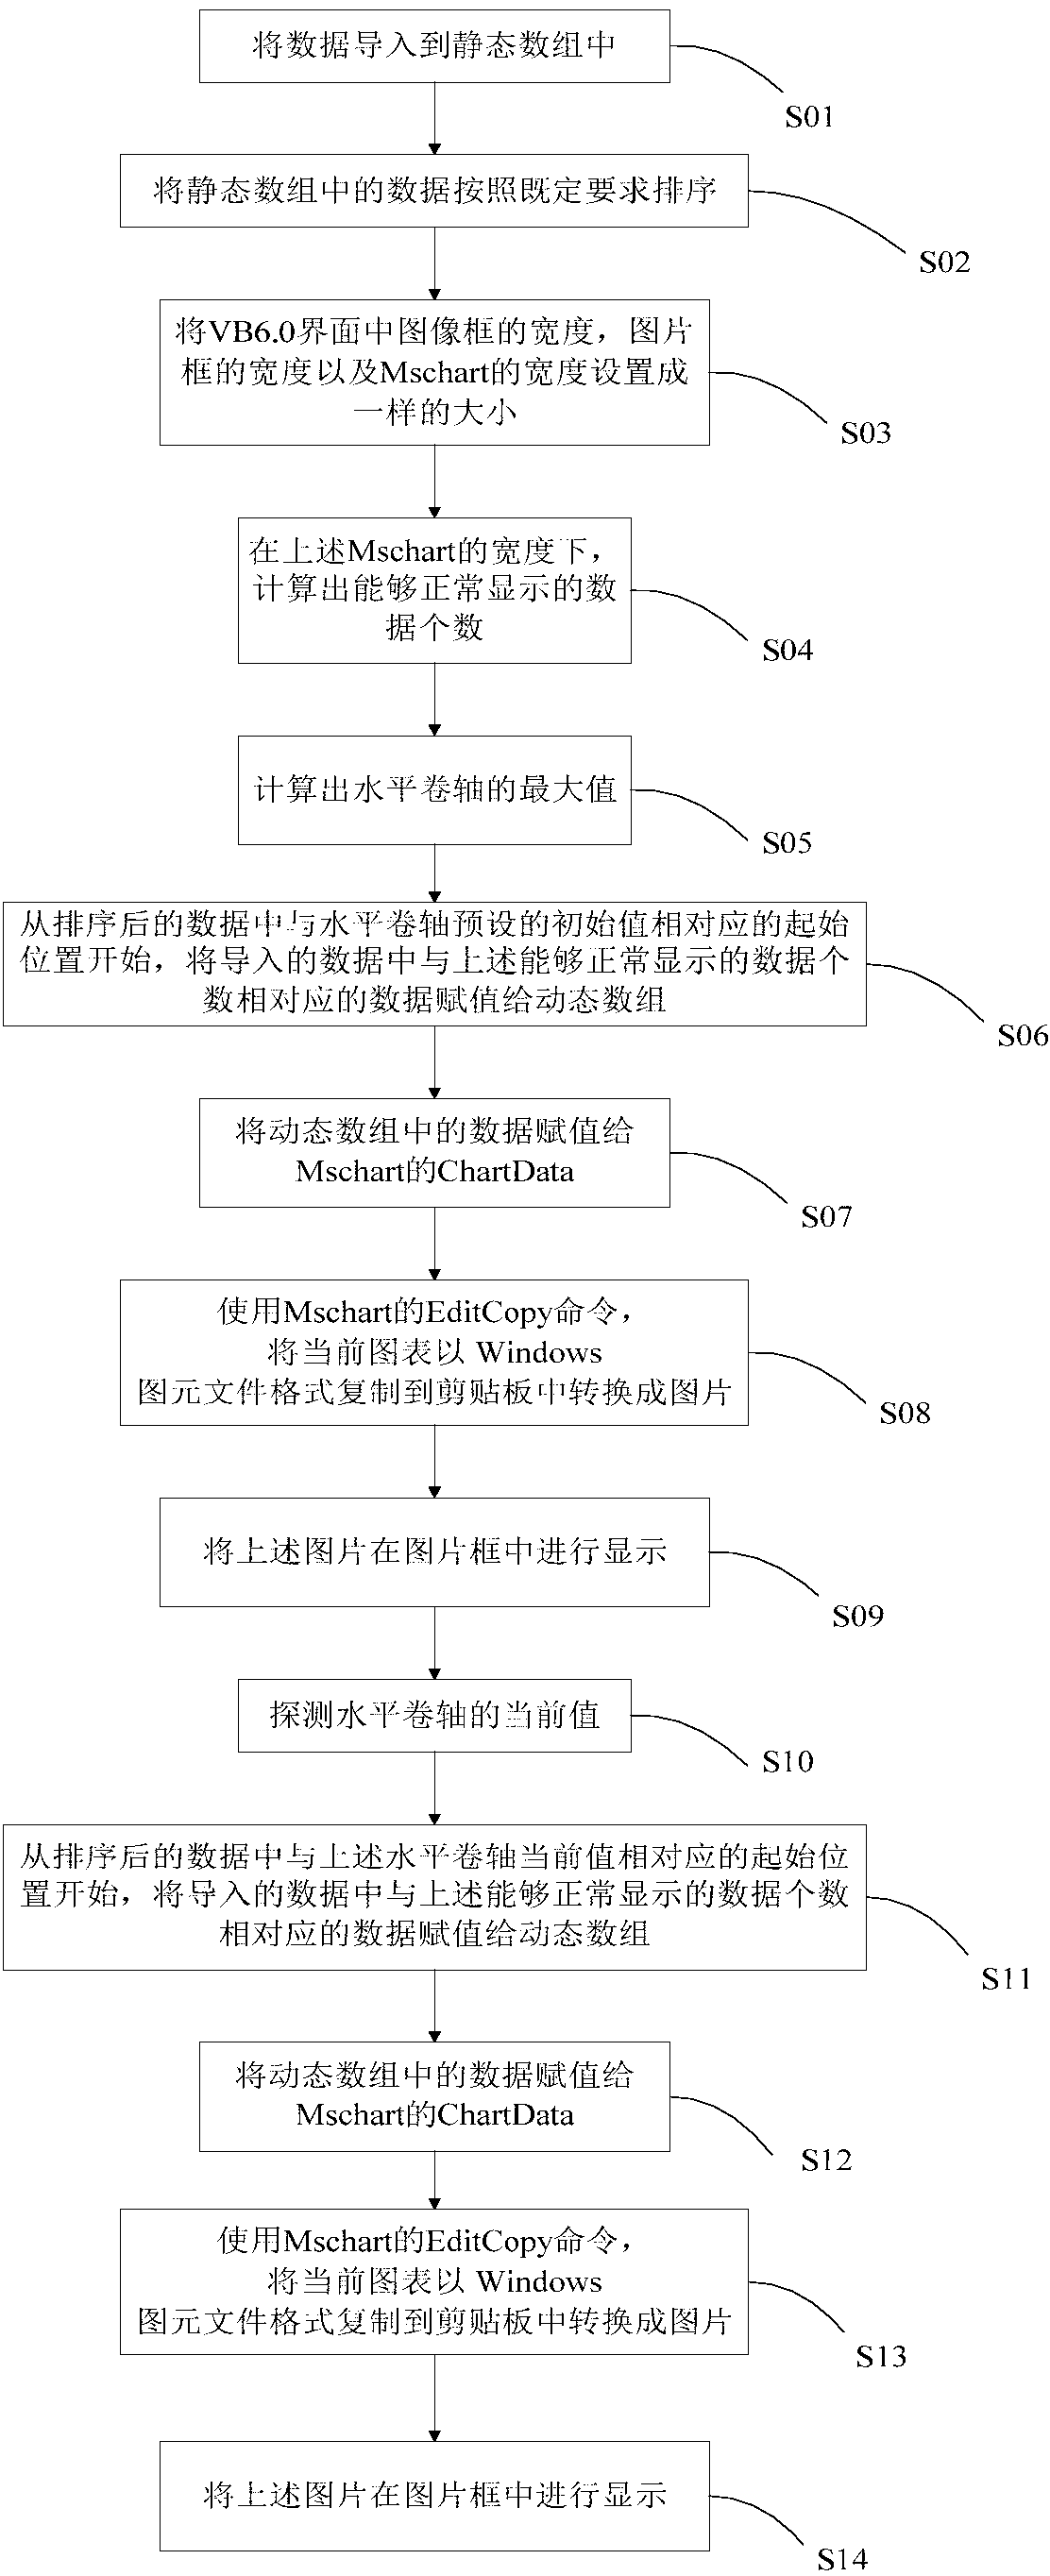
[0026] The specific implementation flow chart of the method for optimizing display data involved in the present invention is as follows: figure 2 As shown, first import the data to be displayed into a static array, such as figure 2 As shown in S01, then sort the data in the above static array according to the established requirements, such as figure 2 As shown in S02, in order to make the number of data displayed by Mschart control A, image frame B and picture frame C consistent, set the width of Mschart control A, image frame B and picture frame C in the VB6.0 interface to be the same size, such as figure 2 As shown in S03, calculate the number of data that can be ...


PUM


Abstract

The invention discloses a method for optimizing display data. The method comprises the steps that data are imported into a static array; the number of the data and the maximum value of a horizontal reel are calculated, wherein the number of the data and the maximum value of the horizontal reel can be normally displayed in the set width of a chart control; data, corresponding to the data number which can be normally displayed, in the imported data are imported into a dynamic array starting from the starting position, corresponding to the initial value preset by the horizontal reel, in the imported data; the data in the dynamic array are assigned to the chart control to form a chart; the present chart is converted into a picture; the picture is displayed; the present value of the horizontal reel is detected, and the picture displaying process is triggered again according to the value. According to the method for optimizing the display data, the data can be displayed in the chart control at equal intervals, and imported data volume cannot be limited by the chart control any more.

Description

technical field [0001] The invention relates to a method for displaying data, especially a method for displaying data in VB6.0. Background technique [0002] VB6.0's built-in graphics control Mschart cannot set the data display interval when drawing a picture, so that when the data is displayed, the display interval will be automatically adjusted equally according to the width of the Mschart control. When less data is displayed, the data can be displayed normally on the drawing interface; when the data is larger than a certain amount, the display interval of the data will become smaller or even turn the image into black, affecting the user experience. For example, the maximum width of the Mschart control is 245745. If there is a lot of data displayed, the width of the data will be greater than the maximum width of the Mschart control under the condition that it is clearly and correctly displayed. At this time, when the above data are displayed in the drawing interface at the...

Claims


Application Information

Patent Timeline
Patent Type & Authority Applications(China)
IPC IPC(8): G06F9/44G06F17/30
Inventor 孙宝三
Owner SHENZHEN ARTEL TECH
Learn More