Method and device for generating visualized view

A view and device technology, applied in the Internet field, can solve problems such as inability to visualize large amounts of data, poor visualization support for large amounts of data, and inability to mine data, so as to facilitate data mining and processing, improve information acquisition efficiency, and improve user experience. Effect

Active Publication Date: 2013-11-27
BEIJING BAIDU NETCOM SCI & TECH CO LTD
View PDF4 Cites 40 Cited by
  • Summary
  • Abstract
  • Description
  • Claims
  • Application Information

AI Technical Summary

Problems solved by technology

However, the existing visualization tools have poor support for the visualization of large amounts of data, and cannot visually present large amounts of data intuitively and clearly.
Moreover, the current visual view tool can only obtain the large amount of data by obtaining the form, and cannot further mine the data through interaction with the visual view

Method used


Image

  • Method and device for generating visualized view
  • Method and device for generating visualized view
  • Method and device for generating visualized view

Examples


Embodiment Construction

[0034] The present invention will be described in further detail below in conjunction with the accompanying drawings.

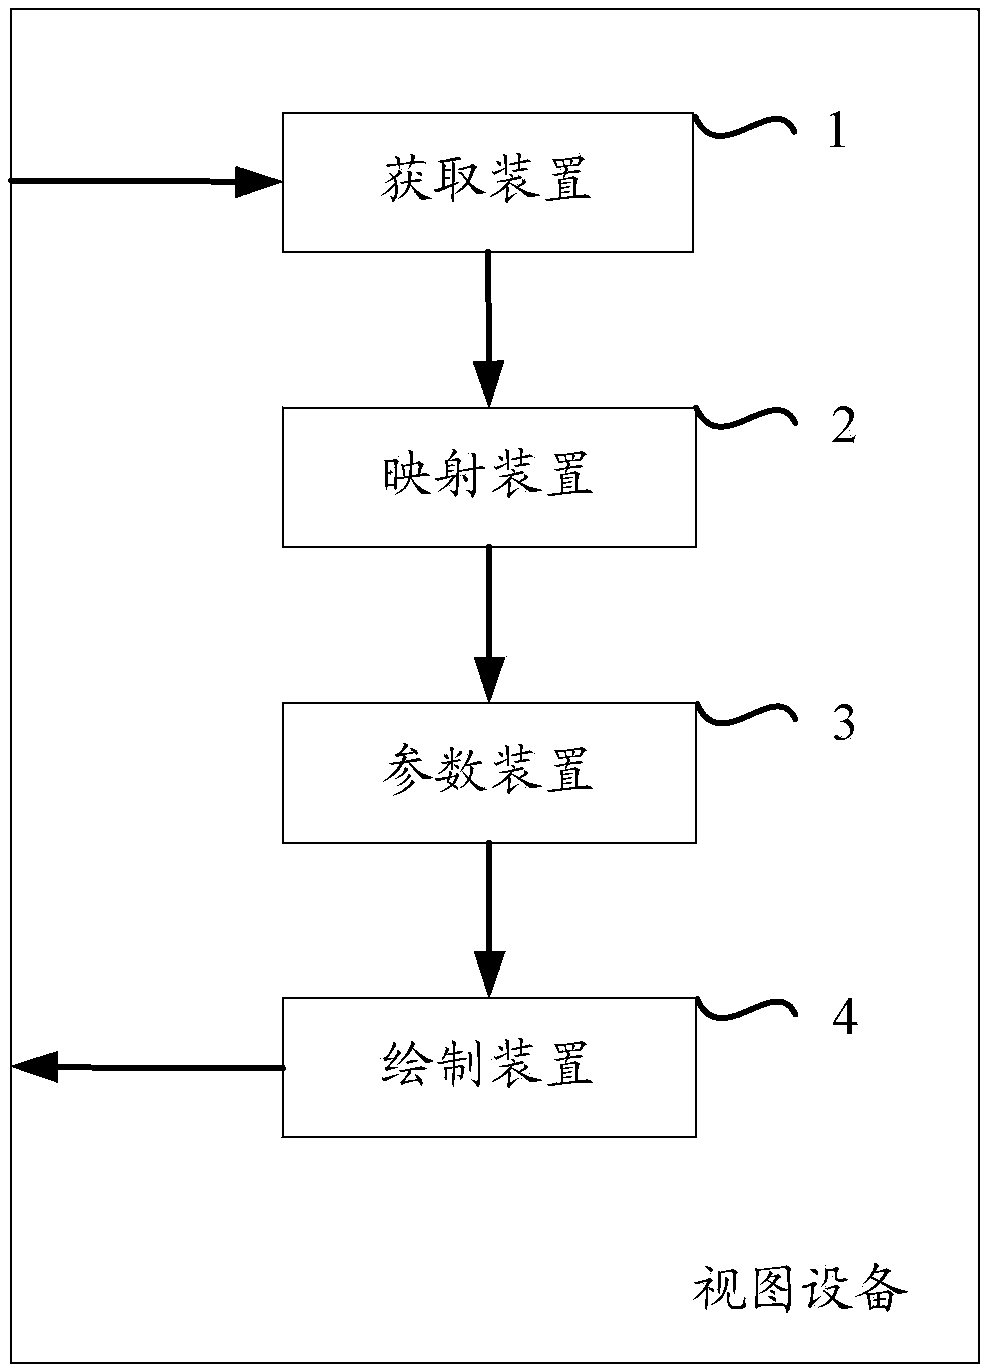
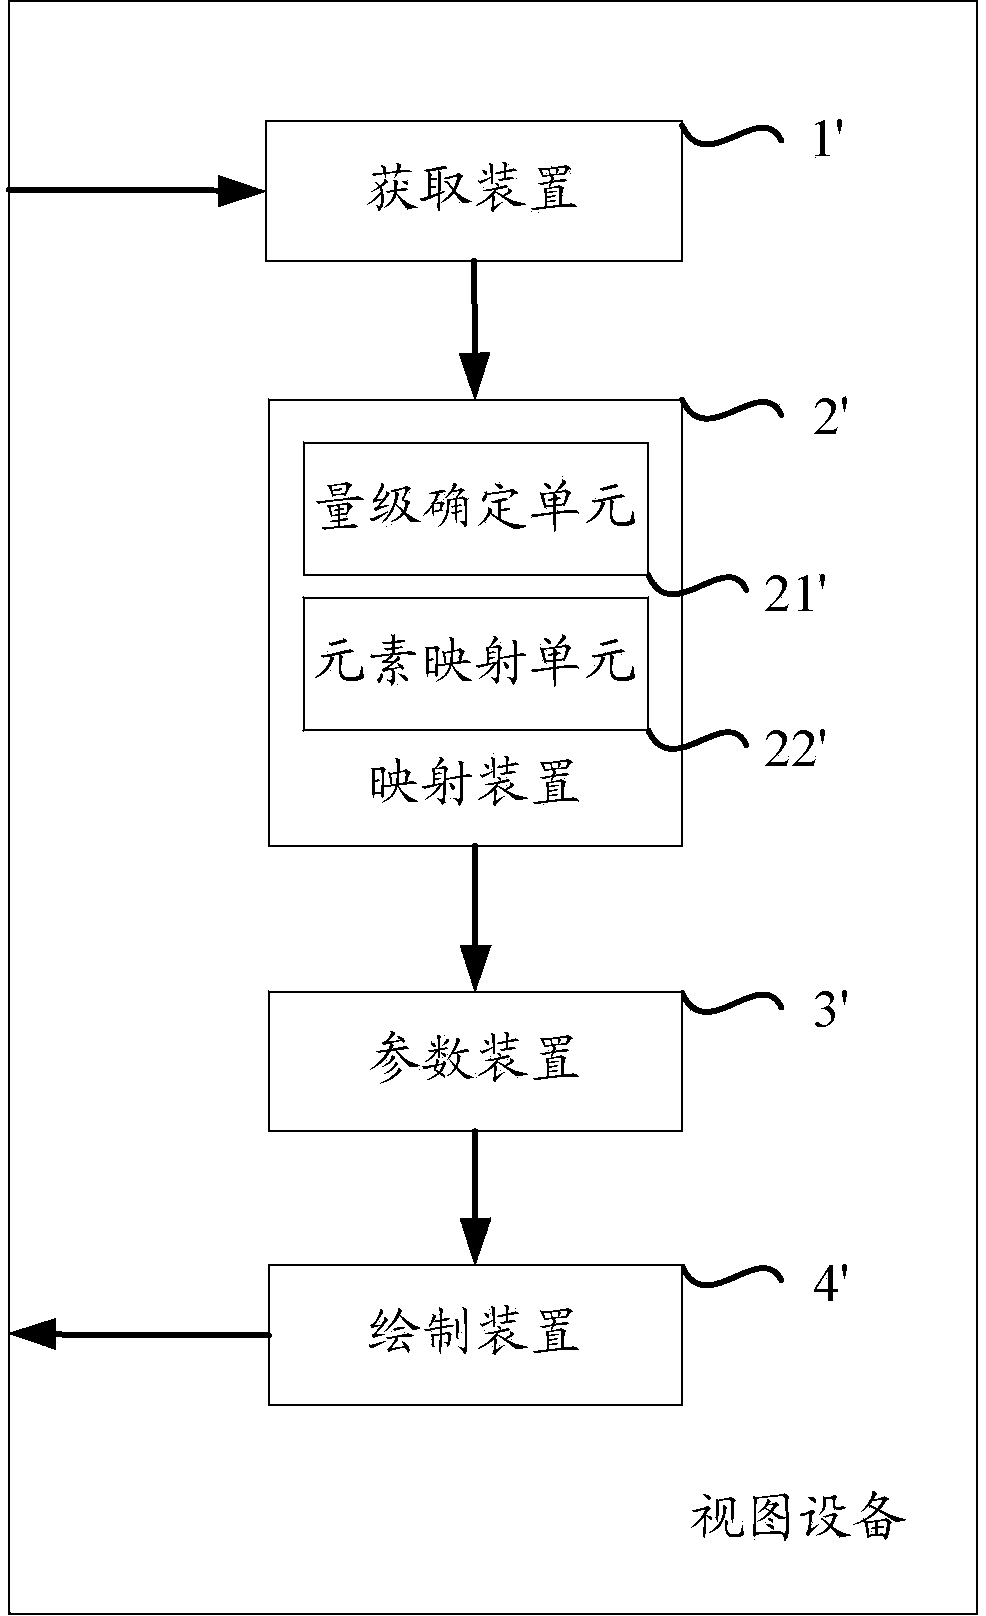
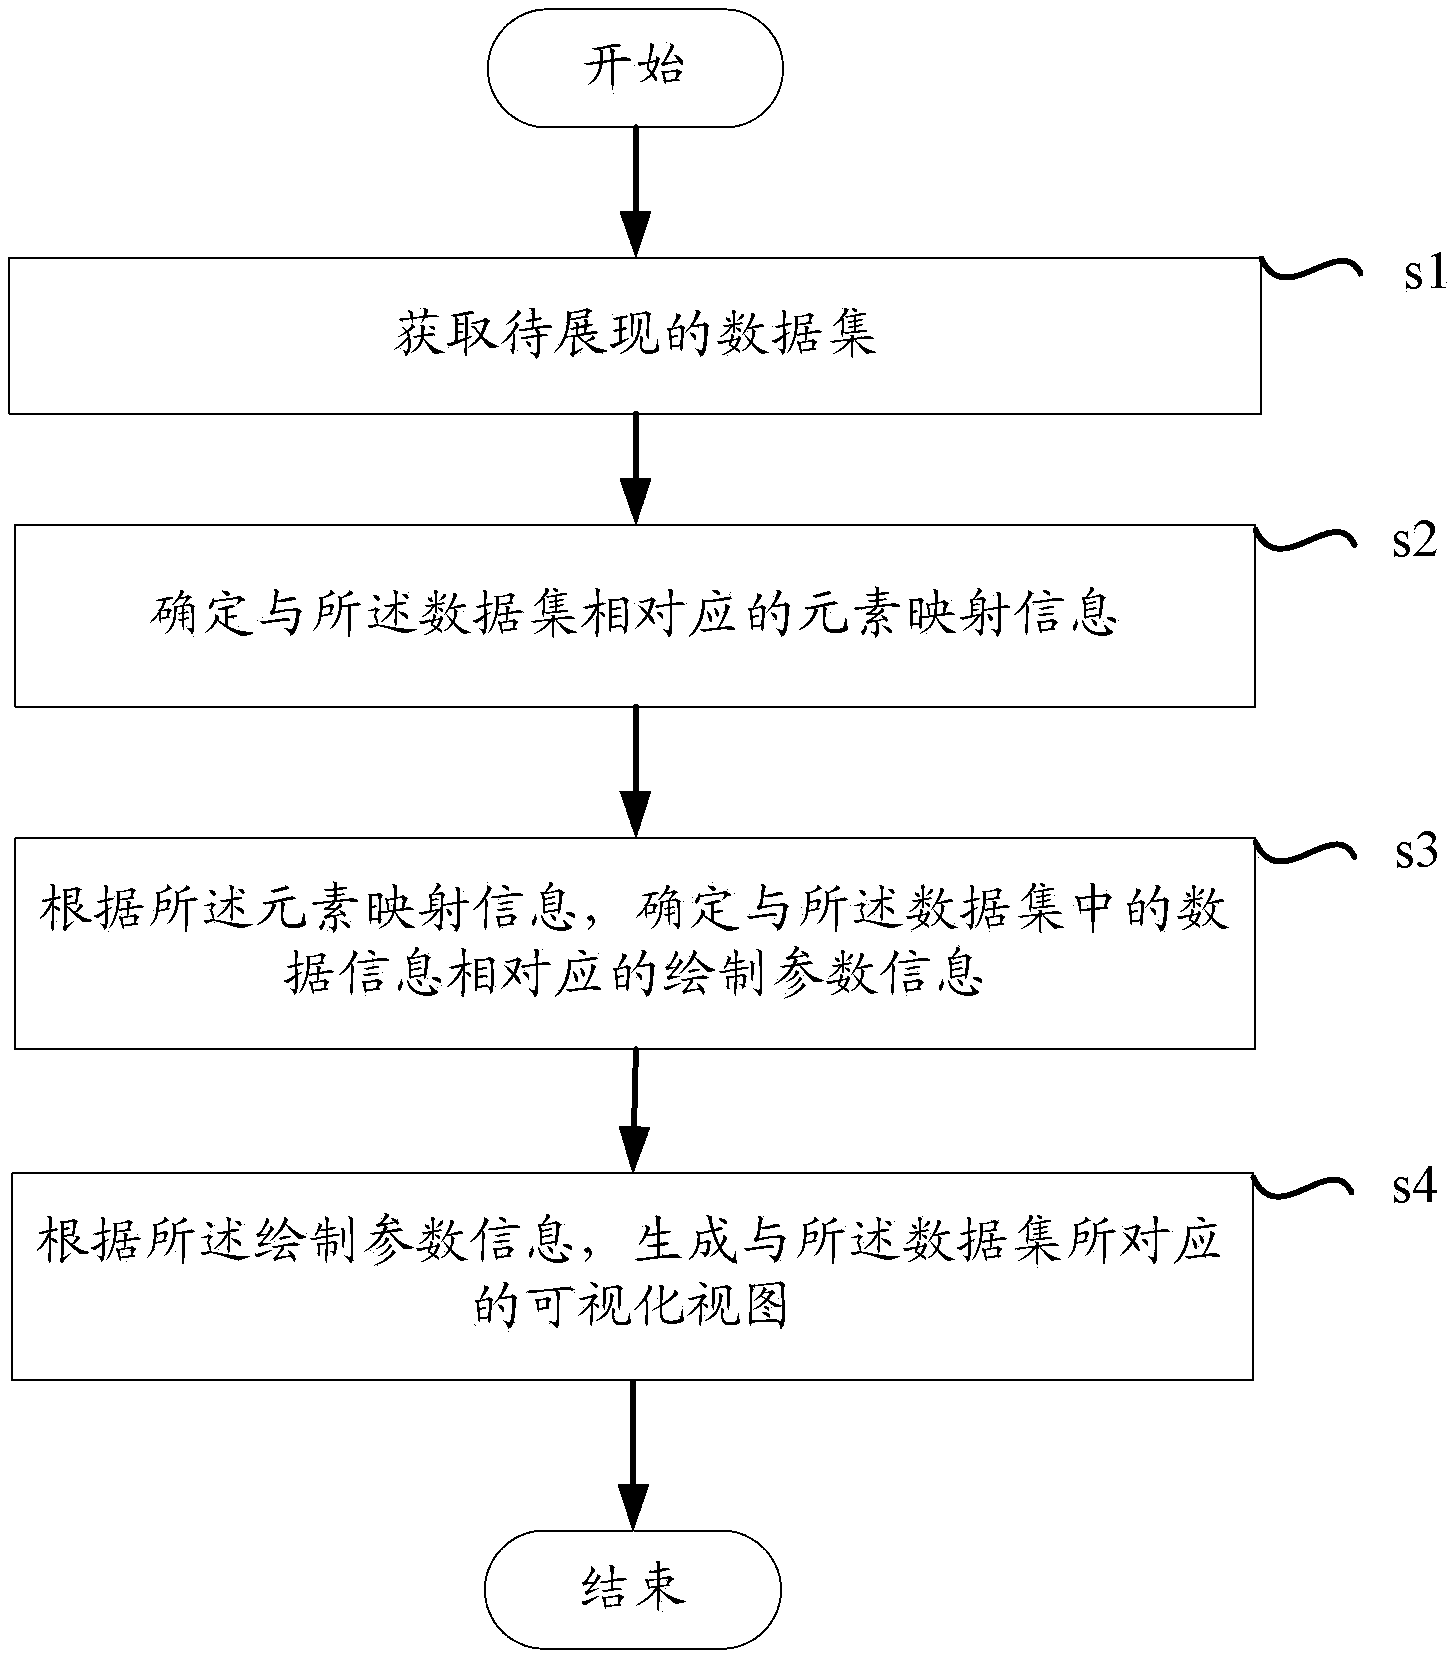
[0035] figure 1 A schematic diagram of a view device for generating a visualized view according to one aspect of the present invention is shown; wherein, the view device includes an acquisition device 1 , a mapping device 2 , a parameter device 3 , and a rendering device 4 . Specifically, the obtaining device 1 obtains the data set to be displayed; the mapping device 2 determines the element mapping information corresponding to the data set; the parameter device 3 determines the data information corresponding to the data set in the data set according to the element mapping information The rendering parameter information; the rendering device 4 generates a visualization view corresponding to the data set according to the rendering parameter information.

[0036] Here, the view device includes, but is not limited to, a network device, a user device, or a devic...


PUM


Abstract

The invention provides a method and device for generating a visualized view. The method includes the steps of enabling the view device to obtain a data set to be revealed, determining element mapping information, such as pixels or graphs, corresponding to the data set, according to the element mapping information, determining drawing parameter information corresponding to data information in the data set, and finally generating the visualized view corresponding to the data set according to the drawing parameter information. Compared with the prior art, the method and device for generating the visualized view have the advantages that visualized view carried out on data sets which comprise the large data volume and are in various types is achieved, particularly, drawing on the large data volume at the web end is achieved, and therefore the resource consumption at the server end is reduced. Data is visually revealed, therefore, the information obtaining efficiency of a user is improved, the user can conveniently carry out data mining and processing, and the use experience of the user is improved.

Description

technical field [0001] The invention relates to the field of the Internet, in particular to a technology for generating visual views. Background technique [0002] Using the visual view to present and analyze information can intuitively present data statistical results and visually interpret various data components. Therefore, it is a data analysis method commonly used by current data workers. For example, a commonly used statistical charting tool for data, such as Excel, a component of Microsoft Office developed by Microsoft Corporation, can generate specified statistical charts for data according to specific data items. [0003] As the data that users need to process becomes more and more complex and the amount of data to be processed increases, users need to be able to visualize large amounts of data. However, the existing visualization tools have poor support for the visualization of large amounts of data, and cannot visually present large amounts of data intuitively an...

Claims


Application Information

Patent Timeline
Patent Type & Authority Applications(China)
IPC IPC(8): G06F17/30
Inventor 杨骥林志峰
Owner BEIJING BAIDU NETCOM SCI & TECH CO LTD
Why Eureka
Try Eureka