Production of olefin oxides
A technology for oxidizing olefins and olefins, which is applied in the field of hydrocarbon oxidation systems and can solve problems such as out of control
- Summary
- Abstract
- Description
- Claims
- Application Information
AI Technical Summary
Problems solved by technology
Method used
Image
Examples
Embodiment 1
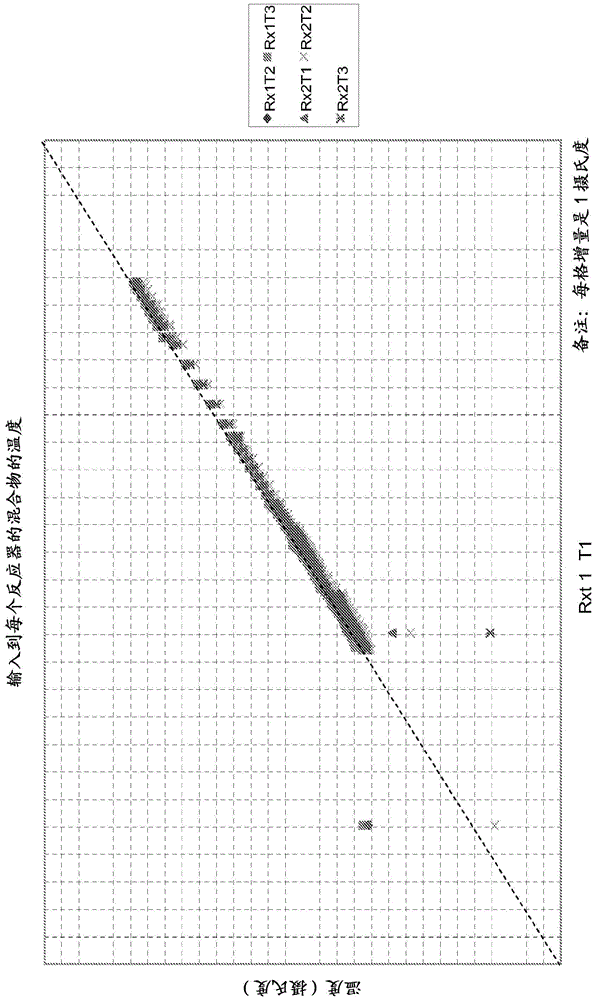
[0065] Example 1- image 3
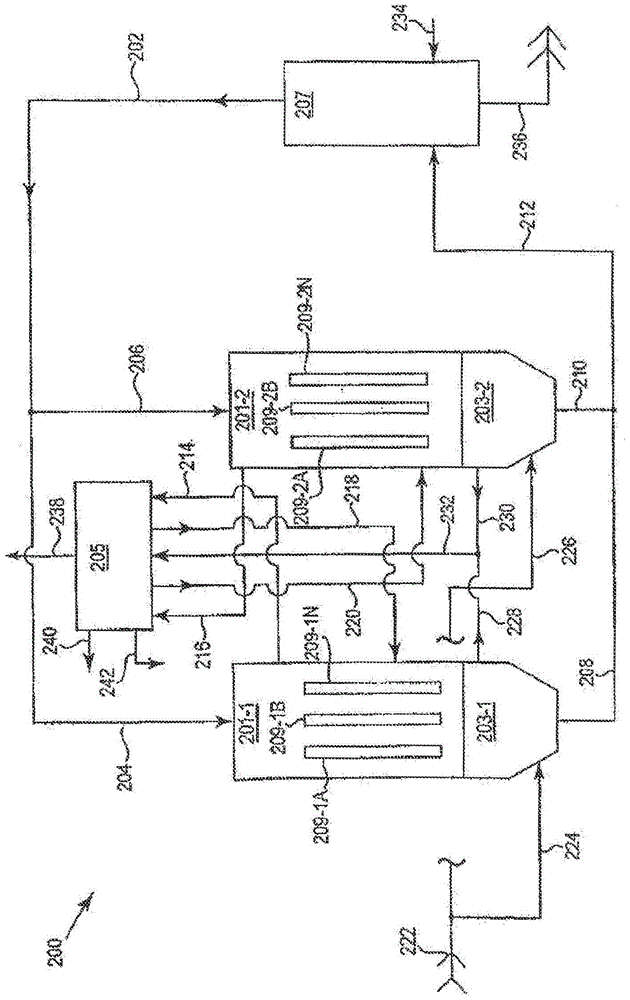
[0066] image 3is a mixture containing olefins and oxygen and supplied to two reactors Rx1 and Rx2 (for example, figure 2 , a representative graph of the temperature of stream 204 supplied to reactor 201-1 and stream 206 supplied to reactor 201-2). Temperature readings of the same value are represented by dots overlapping each other. Such an ideal situation is represented by a dashed line with a slope of 1, also known as a single line. Such as image 3 As shown, the temperature readings at the inlets of each reactor are predicted to be essentially the same for mixtures comprising olefins and oxygen (eg, the temperature readings closely follow the single line). As described herein, the substantially identical temperature readings for the inlets of each reactor are a direct result of the increased controllability of one coolant drum and single cross-flow heat exchanger for the two reactors.
Embodiment 2
[0067] Example 2 – Figure 4
[0068] Figure 4 is the outlet product of the two reactors Rx1 and Rx2 containing olefin oxides (e.g., figure 2 , a representative graph of the temperature of stream 208 from reactor 201-1 and stream 210 from reactor 201-2). Such as Figure 4 As shown, the temperature measurements of the product outlet streams of each reactor Rx1 and Rx2 are predicted to be substantially the same. Therefore, the temperature measurement is similar to the single line. As described herein, the temperature readings for the product outlet streams of each reactor were substantially the same as a direct result of the increased controllability of one coolant drum and single cross-flow heat exchanger for the two reactors.
Embodiment 3
[0069] Example 3 – Figure 5
[0070] Figure 5 is the coolant fluid outlet of each of reactors Rx1 and Rx2 (e.g., figure 2 , a representative graph of the temperature of stream 214 from reactor 201-1 and stream 216 from reactor 201-2). A temperature indication of the same value for each reactor will produce a line with a slope of 1, also known as Figure 5 The single line indicated by the dotted line above. Such as Figure 5 As shown, the temperature measurements of the coolant fluid outlet streams of each reactor are predicted to be substantially equal. A predictive representation of the accurate nature of the coolant fluid outlet stream temperatures from the two reactors, in contrast to previous methods such as Figure 6 ) compared to the improvement in coolant temperature control.
PUM
 Abstract
Description
Claims
Application Information
 - R&D
- Intellectual Property
- Life Sciences
- Materials
- Tech Scout
- Unparalleled Data Quality
- Higher Quality Content
- 60% Fewer Hallucinations
Browse by: Latest US Patents, China's latest patents, Technical Efficacy Thesaurus, Application Domain, Technology Topic, Popular Technical Reports.
© 2025 PatSnap. All rights reserved.Legal|Privacy policy|Modern Slavery Act Transparency Statement|Sitemap|About US| Contact US: help@patsnap.com


