Waveform display device and method

A waveform display, real-time waveform technology, applied in digital variable/waveform display, measurement devices, instruments, etc., can solve the problem of occupying large system memory, achieve good observation effect, save data storage space effect

Active Publication Date: 2014-06-18
RIGOL
View PDF5 Cites 15 Cited by
  • Summary
  • Abstract
  • Description
  • Claims
  • Application Information

AI Technical Summary

Problems solved by technology

[0006] The main purpose of the embodiments of the present invention is to provide a waveform display device and method to solve the problem that existing waveform display devices often need to occupy a large amount of system memory when displaying trend waveforms of collected data

Method used


Image

  • Waveform display device and method
  • Waveform display device and method
  • Waveform display device and method

Examples


Embodiment 1

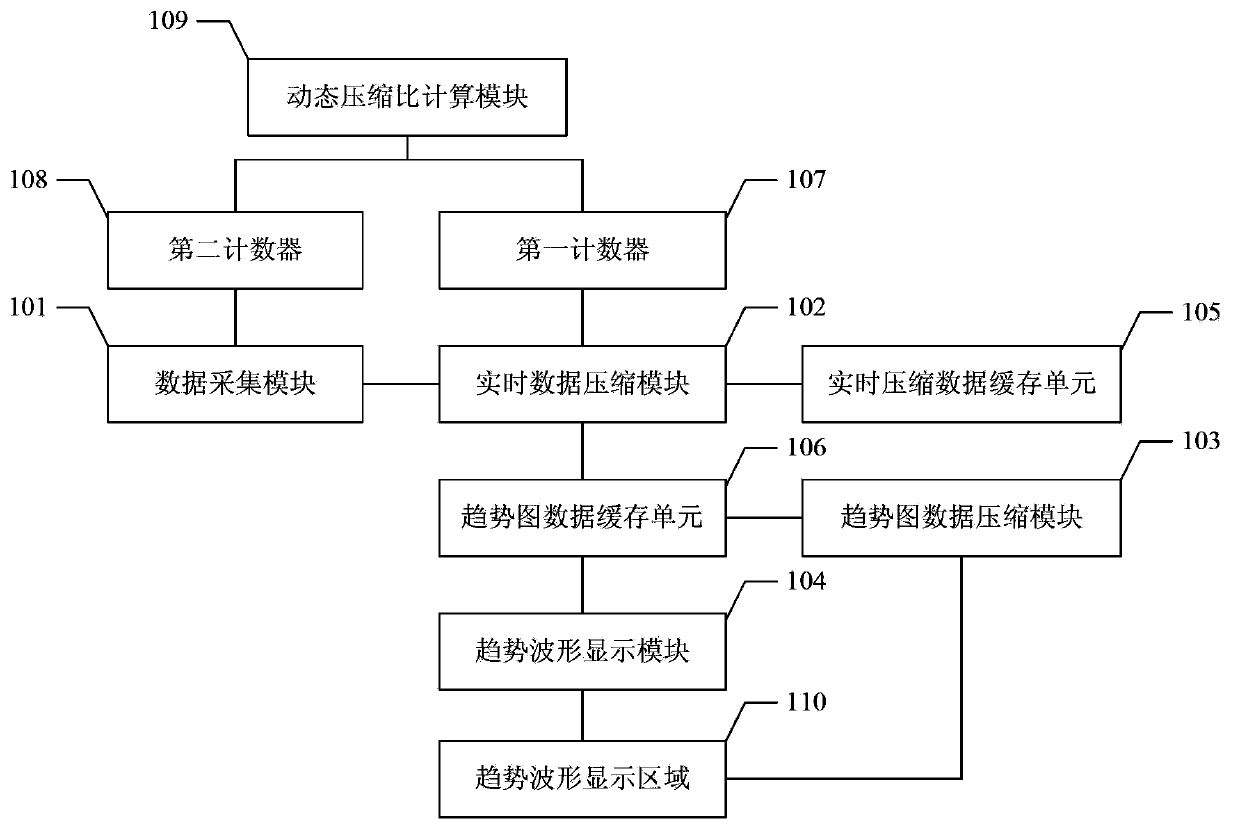
[0064] This embodiment provides a waveform display device, such as figure 1 As shown, the device includes: a data acquisition module 101, a real-time data compression module 102, a trend graph data compression module 103, a trend waveform display module 104, a real-time compressed data cache unit 105, a trend graph data cache unit 106, a first counter 107, Second counter 108, dynamic compression ratio calculation module 109 and trend waveform display area 110; Wherein,

[0065] The data acquisition module 101 is used to collect data, and transmits the collected data to the real-time data compression module 102;

[0066] The first counter 107 is used for counting the collected data transmitted from the data collection module 101 to the real-time data compression module 102 to obtain a count value;

[0067] The second counter 108 is used to calculate the total number of data collected by the data collection module 101;

[0068] A dynamic compression ratio calculation module, c...

Embodiment 2

[0129] This embodiment provides a waveform display method, including:

[0130] According to the first data compression method, the collected data and the existing data in the real-time compressed data cache unit are compressed to obtain the first compressed data, and the real-time compressed data cache unit is updated by using the first compressed data; the collected data is counted to obtain count value;

[0131] When it is determined that the count value reaches the current dynamic compression ratio, the data in the real-time compressed data cache unit is added to the trend graph data cache unit, the real-time compressed data cache unit is cleared, and the count value is set to zero; The current dynamic compression ratio is the ratio of the total number of currently collected data to the set number of groups;

[0132] When it is determined that the amount of data in the trend graph data cache unit reaches the set upper limit, the data in the trend graph data cache unit is c...

Embodiment 3

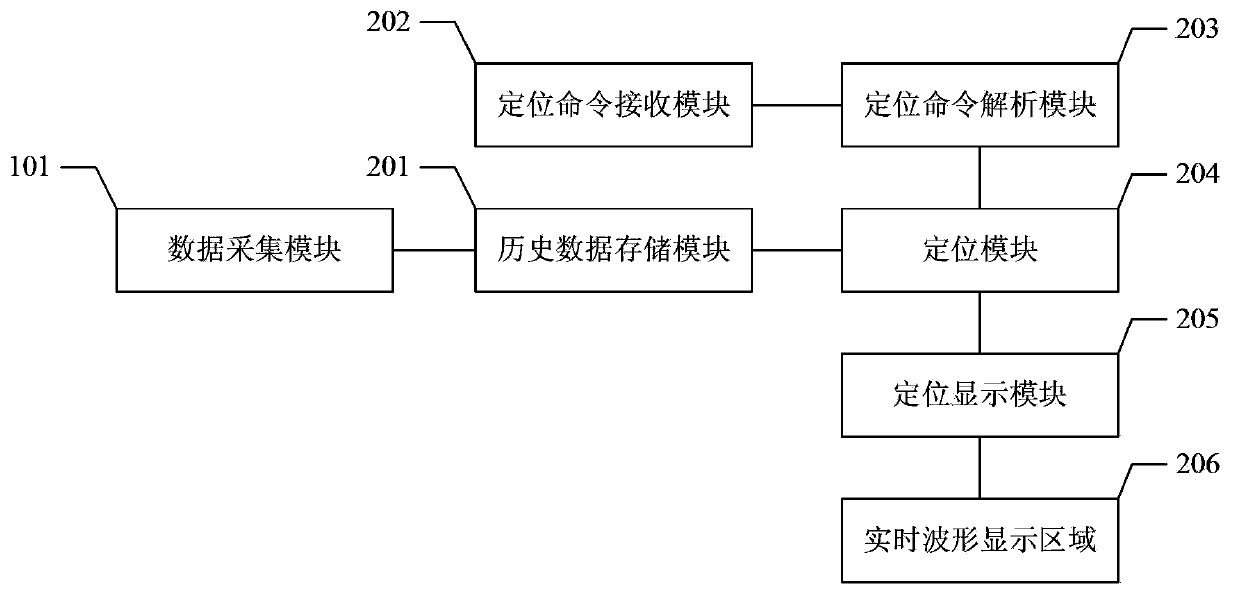
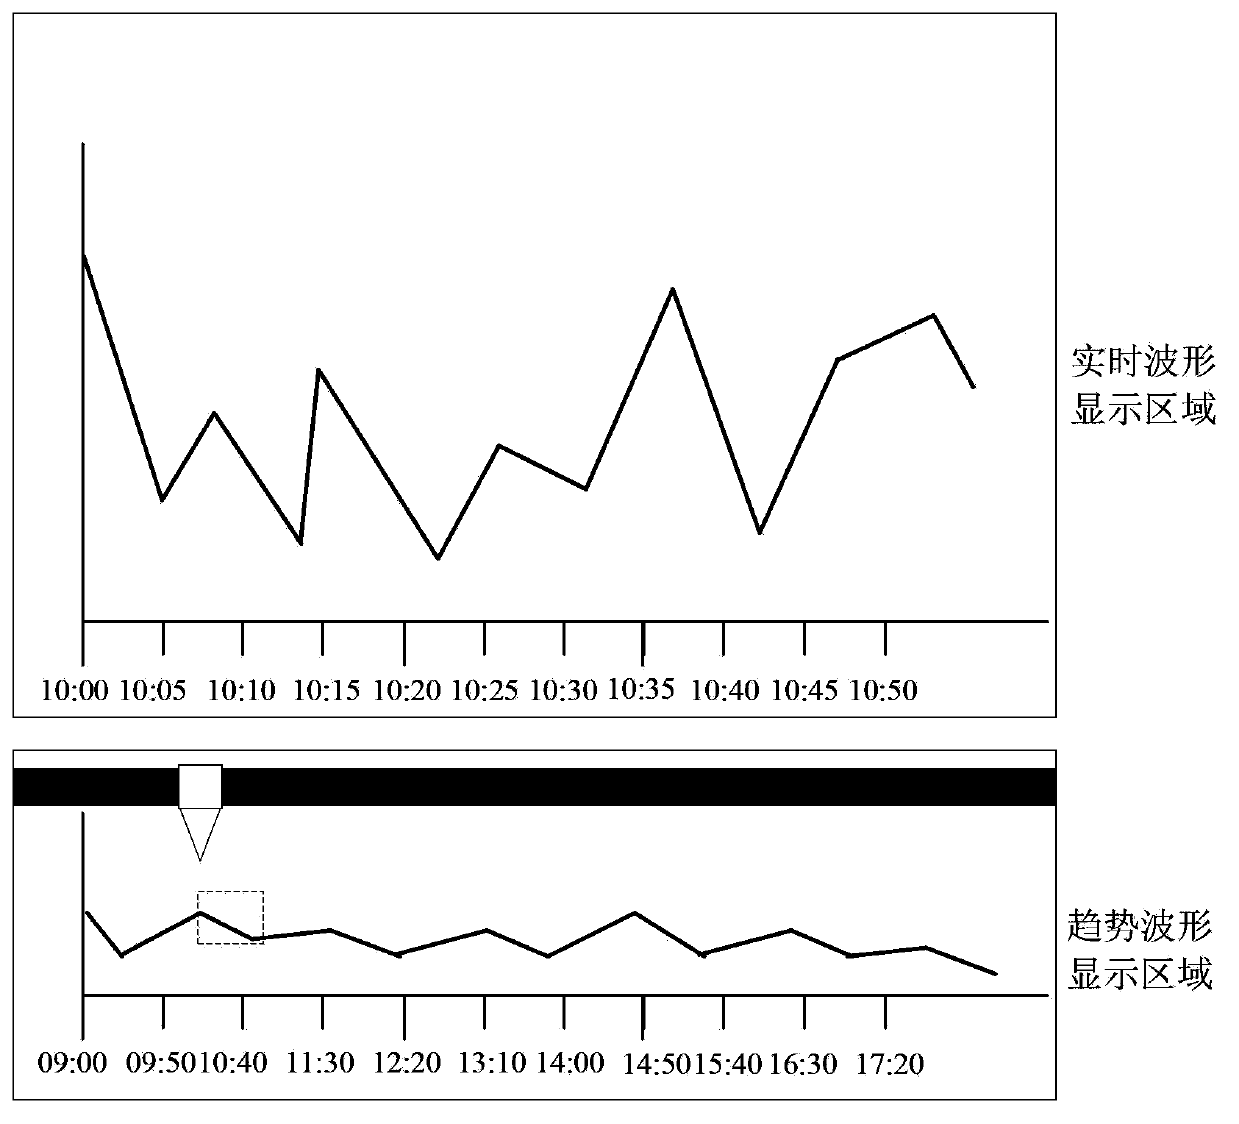
[0155] This embodiment provides a waveform display device, such as Figure 5 As shown, the waveform display device includes: a data acquisition module 501, a real-time data compression module 502, a trend graph data compression module 503, a trend waveform display module 504, a real-time compressed data cache unit 505, a trend graph data cache unit 506, and a first counter 507, second counter 508, dynamic compression ratio calculation module 509, historical data storage module 510, positioning command receiving module 511, positioning command analysis module 512, positioning module 513, positioning display module 514, real-time waveform display module 515, cutting module 516 , a real-time waveform display area 517 and a trend waveform display area 518; wherein, the real-time waveform display area 517 and the trend waveform display area 518 are arranged vertically, and the real-time waveform display area 517 is at the top, and the trend waveform display area 518 is at the bottom...


PUM


Abstract

The invention provides a waveform display device and method. The waveform display device comprises a data acquisition module, a real time data compression module, a trend chart data compression module, a trend waveform display module, a real time compression data buffer unit, a trend chart data buffer unit, a first counter, a second counter, a dynamic compression ratio calculation module and a trend waveform display area. The purpose of displaying an acquisition data trend waveform is achieved by the real time compression data buffer unit and the trend chart data buffer unit with fixed-size storage spaces, and the data storage space is saved; a historical data positioning function is provided to facilitate a user to observe historical acquisition data in detail; a real time waveform display area and the trend waveform display area are longitudinally arranged, accordingly, the visual confusion phenomenon caused by the connection between the trend waveform and the real time waveform when the data acquisition speed is quicker or the data acquisition just starts is avoided, and the better trend waveform and real time waveform observation effects are provided for the user.

Description

technical field [0001] The present invention relates to the technical field of waveform display, in particular to a waveform display device and method. Background technique [0002] In waveform display devices such as oscilloscopes, as the total number of collected data increases, historical data will continue to be squeezed out of the display area due to the limitation of the display area. Users usually can only see the latest collected data and a part of historical data. When the data After the collection process is over, the user can only observe part of the historical data by sliding the collection time coordinates. In this way, for the long-term data collection process, the user cannot observe the overall change trend of the collected data, and cannot perform comprehensive analysis and prediction. [0003] The patent solution with the application number 201010534702.X describes a digital multimeter that uses waveforms to display measurement results. It provides a trend ...

Claims


Application Information

Patent Timeline
Patent Type & Authority Applications(China)
IPC IPC(8): G01R13/00
Inventor 李东明王悦王铁军李维森
Owner RIGOL
Why Eureka
Try Eureka