
Drawing method of power transmission line bird damage distribution diagram

A technology of transmission lines and distribution maps, applied in 2D image generation, image data processing, instruments, etc., can solve the problem that the parameters such as the selection and size of bird-proof devices are not systematically standardized, and there is no unified understanding of high-risk areas of bird damage , can not truly reflect the actual situation on site and other issues, to achieve the effect of easy promotion and application, strong intuitiveness and high accuracy

Inactive Publication Date: 2015-01-07
STATE GRID CORP OF CHINA +3
View PDF6 Cites 7 Cited by
  • Summary
  • Abstract
  • Description
  • Claims
  • Application Information

AI Technical Summary

Problems solved by technology

At present, the operation units of the power grid often carry out bird damage prevention work mainly based on operating experience, and there is no unified understanding of bird damage high-risk areas
However, the parameters such as type selection and size of the anti-bird device have not been systematically regulated, and there have even been several incidents where the anti-bird device failed.
Therefore, using the existing operating experience to divide the risk level of bird damage areas can not truly reflect the actual situation on the spot, and there are still blind spots

Method used


Image

  • Drawing method of power transmission line bird damage distribution diagram
  • Drawing method of power transmission line bird damage distribution diagram
  • Drawing method of power transmission line bird damage distribution diagram

Examples


Embodiment Construction

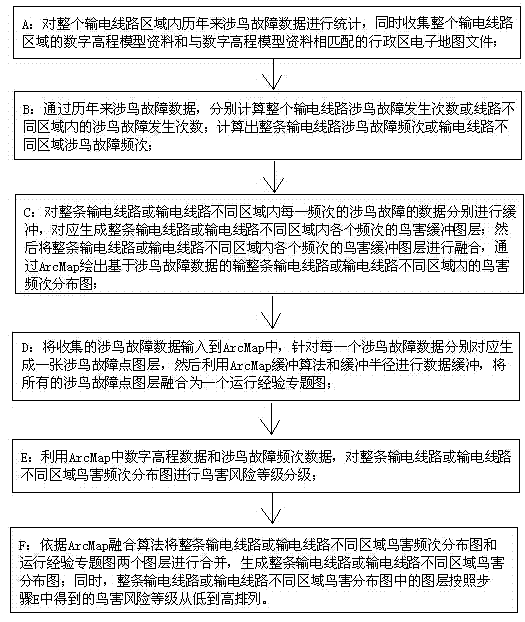
[0027] Such as figure 1 Shown, the drawing method of transmission line bird damage distribution map of the present invention, comprises the following steps:

[0028] A: Make statistics on the bird-related fault data in the entire transmission line area over the years, and at the same time collect the digital elevation model data of the entire transmission line area and the electronic map file of the administrative area that matches the digital elevation model data.

[0029] Because the bird-related fault data is used to analyze, model and verify the bird-related fault elements, the size of the number of bird damage data samples directly determines the accuracy of data modeling. Therefore, the bird-related fault data includes at least more than 10 years in the present invention. Bird nest fault information, line tower bird nest information, big bird fault information and bird activity information; the above four types of information all include the detailed time, place and faul...


PUM


Abstract

The invention discloses a drawing method of a power transmission line bird damage distribution diagram. By collecting bird-related fault data, digital elevation model resources and administrative region electronic maps matched with the digital elevation model resources over the years in a power transmission line zone, a power transmission line whole zone bird damage frequency distribution diagram based on the bird-related fault data and an operation experience thematic diagram are drawn and then are merged, reference bird damage risk levels are arrayed from the low level to the high level, and finally the power transmission line bird damage distribution diagram is generated. Based on the bird-related fault history information and the accurate geographic elements of a corresponding zone, the bird damage distribution diagram is drawn scientifically and accurately, reference frames are provided for planning of bird-damage-resisting management of a built line and a line which is not built, power transmission line bird damage tripping accidents are reduced, and safe operation of a high-voltage overhead transmission line is guaranteed.

Description

technical field [0001] The invention relates to a drawing method of a transmission line disaster distribution map, in particular to a drawing method of a transmission line bird damage distribution map. Background technique [0002] In recent years, with the strengthening of human awareness of the protection of the natural ecological environment, the number of birds has gradually increased, and the threat of birds to the safe operation of high-voltage overhead transmission lines has also increased. The work of preventing bird damage on transmission lines is urgent. In order to avoid the occurrence of tripping accidents due to bird damage on the line, the management of bird damage on the line should be continuously strengthened, the concept should be changed, and the initiative should be attacked. Therefore, it is very urgent and necessary to formulate a method for drawing a distribution map of bird damage on transmission lines, and how to scientifically determine the level of...

Claims


Application Information

Patent Timeline
Patent Type & Authority Applications(China)
IPC IPC(8): G06Q50/06
CPCG06T11/206G06Q50/06
Inventor 余翔刘长义王自立庞锴卢明胡扬宇郑伟夏中原刘刚
Owner STATE GRID CORP OF CHINA
Learn More