Data popularity based monitoring point distribution requirement diagram generation method and apparatus

A technology of demand map and heat, applied in electrical digital data processing, special data processing applications, instruments, etc., can solve the problem of ignoring the attributes of objective things

Active Publication Date: 2015-09-09
ZHEJIANG UNIVIEW TECH CO LTD
View PDF3 Cites 32 Cited by
  • Summary
  • Abstract
  • Description
  • Claims
  • Application Information

AI Technical Summary

Problems solved by technology

However, this method is based on the operation of vector data, that is, to abstract objective things into data structures of points, lines and surfaces for calculation, which ignores the attributes of objective things themselves

Method used


Image

  • Data popularity based monitoring point distribution requirement diagram generation method and apparatus
  • Data popularity based monitoring point distribution requirement diagram generation method and apparatus
  • Data popularity based monitoring point distribution requirement diagram generation method and apparatus

Examples


Embodiment Construction

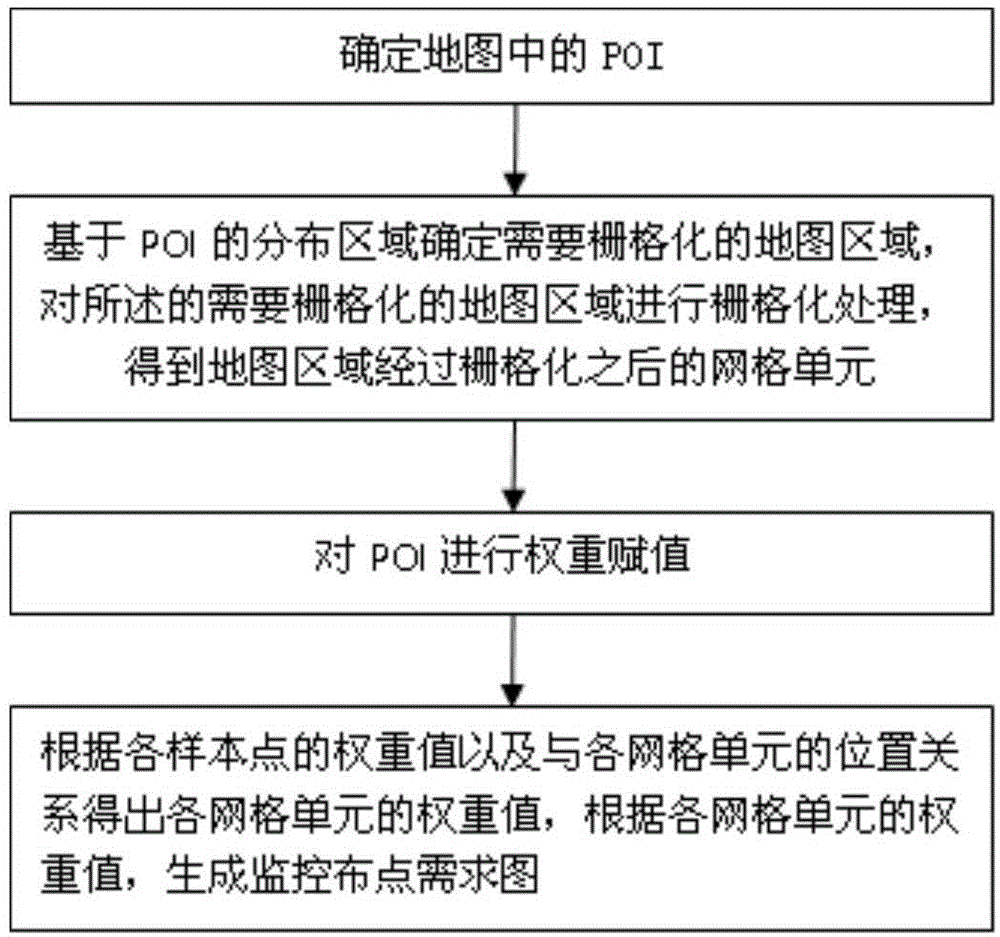
[0052] In order to make the present invention clearer, the present invention will be explained in detail in conjunction with the accompanying drawings and embodiments. Examples of the present invention image 3 shown, including the following steps:

[0053] Step 1: Determine the sample points on the map.

[0054] Step 1 is performed by the sample point determination unit.

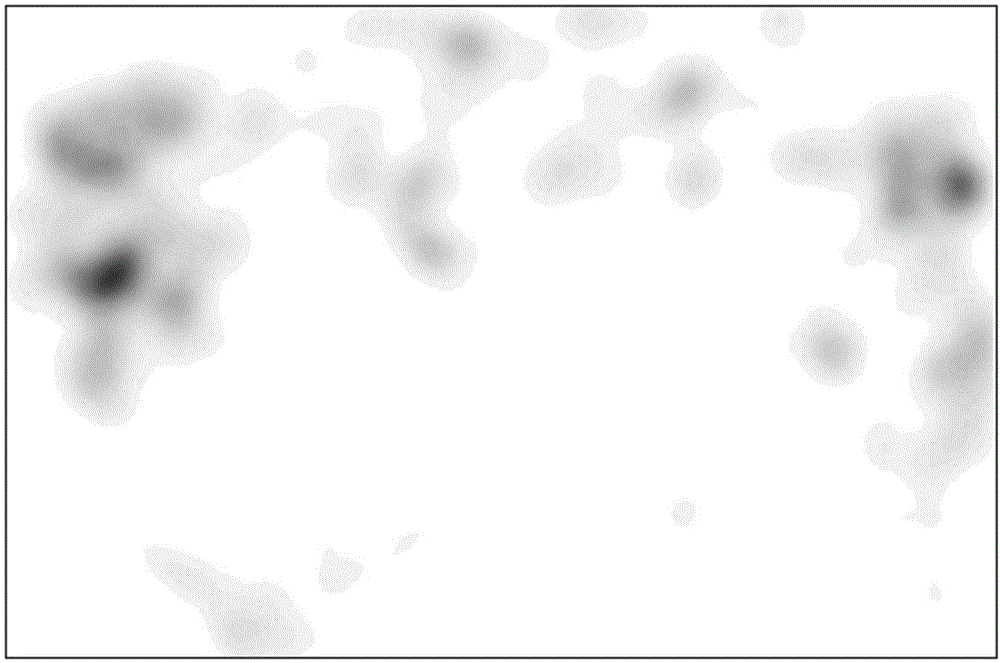
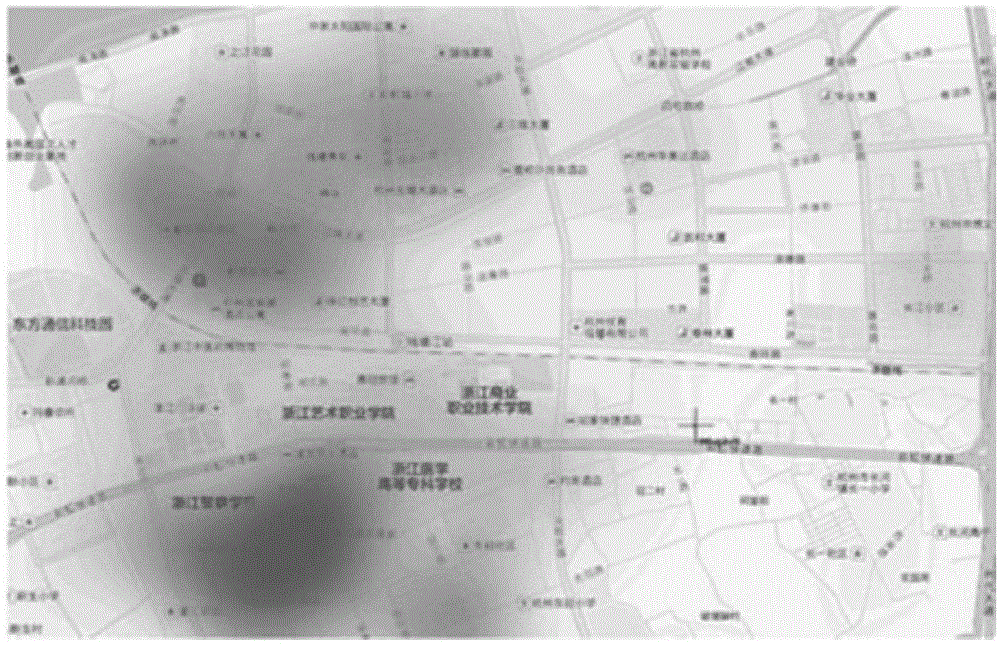
[0055] There are many ways to select sample points, including the distribution of the location where the case occurred, the distribution of existing camera points, etc., all of which can reflect the distribution requirements of monitoring, and the corresponding points on the map of such locations can be used as sample points for extraction . Since the distribution of POIs can more comprehensively reflect the flow of people in the monitored area, the denser the POI density, the higher the heat of the area, and it is also the area where the flow of people gathers. For monitoring, these areas are also the f...


PUM


Abstract

The present invention discloses a data popularity based monitoring point distribution requirement diagram generation method. The method comprises the steps of: determining sample points on a map, and determining a to-be-rasterized map region based on a distribution region of the sample points; performing rasterization processing on the to-be-rasterized map region, and obtaining grid units of the map region subjected to rasterization; performing weight assignment on the sample points; obtaining the weight value of each grid unit according to the weight value of each sample point and a position relationship between the sample point and the grid unit; and generating a monitoring point distribution requirement diagram according to the weight value of the grid unit. The present invention further discloses data popularity based monitoring point distribution requirement diagram generation method by using the method; the monitoring point distribution requirement diagram generation method and apparatus have the outstanding advantages that the sample points reflect monitoring point distribution requirements of the objective world; the weight values of the sample points reflect the requirement size; the regional popularity is taken into account, and higher credibility is achieved.

Description

technical field [0001] The invention relates to the technical field of video monitoring, in particular to a method and device for generating a monitoring point distribution demand map based on data heat. Background technique [0002] At present, video surveillance has been widely used in the daily management of cities, but the layout theory of monitoring points lags behind its application, which objectively causes the unreasonable layout of monitoring points in practical applications. [0003] The current camera layout method is to abstract the objective world into points (such as intersections, ATM machines, etc.), lines (roads), and surfaces (CBD, large shopping malls, etc.), and then calculate the coverage area of ​​the monitoring point. According to whether the coverage area includes objective The world, or the extent to which the objective world includes is used to judge the scientificity of the monitoring point layout, and then adjust and obtain the final camera layout...

Claims


Application Information

Patent Timeline
Patent Type & Authority Applications(China)
IPC IPC(8): G06F17/50
Inventor 叶敏挺何伟魏
Owner ZHEJIANG UNIVIEW TECH CO LTD
Why Eureka
Try Eureka