
Evaluation methods and phantom samples for optical analysis devices

An evaluation method and optical analysis technology, which is applied in the direction of material analysis, material analysis, and measuring devices through optical means, and can solve problems such as inaccurate optical system states

Inactive Publication Date: 2018-01-19
OLYMPUS CORP
View PDF9 Cites 0 Cited by
  • Summary
  • Abstract
  • Description
  • Claims
  • Application Information

AI Technical Summary

Problems solved by technology

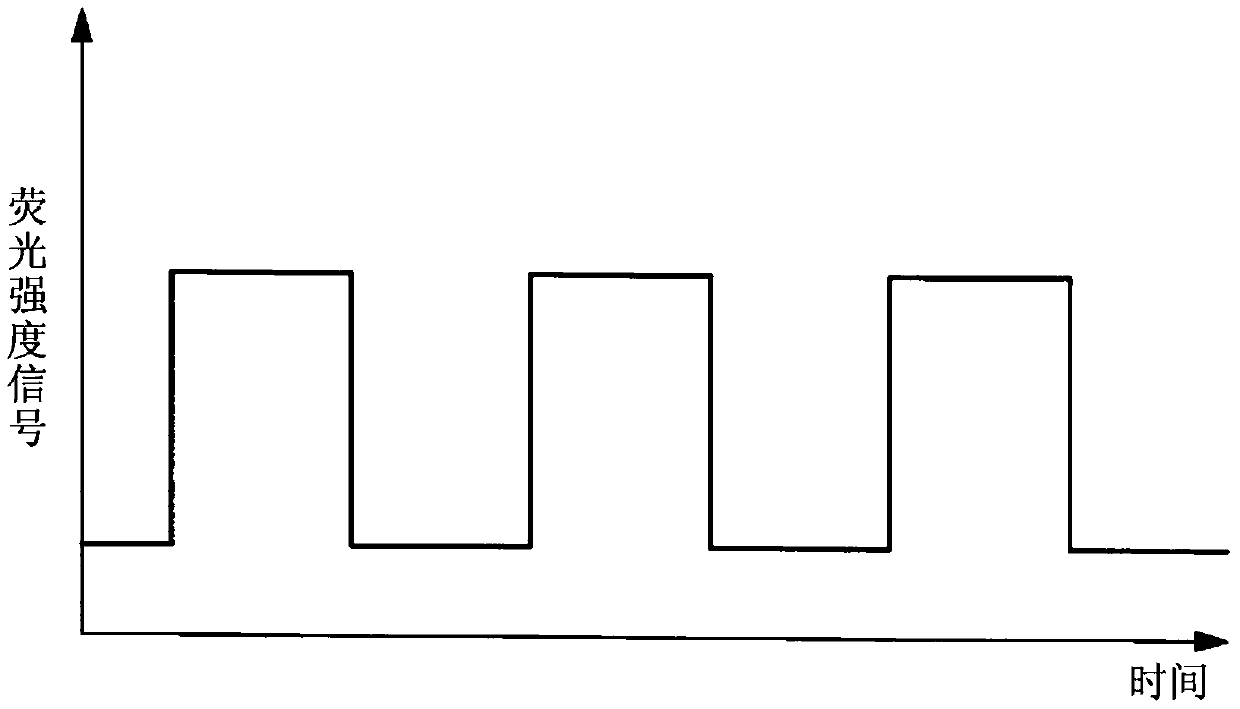
[0007] At this time, when it is confirmed that the number of peaks obtained for a certain predetermined concentration is less than the number estimated from the optical system, or the height of the pulse train of photons forming the peak is small, that is, the intensity of fluorescence is small, etc., these Indicates that the state of the optical system is inaccurate

Method used


Image

  • Evaluation methods and phantom samples for optical analysis devices
  • Evaluation methods and phantom samples for optical analysis devices
  • Evaluation methods and phantom samples for optical analysis devices

Examples


Embodiment Construction

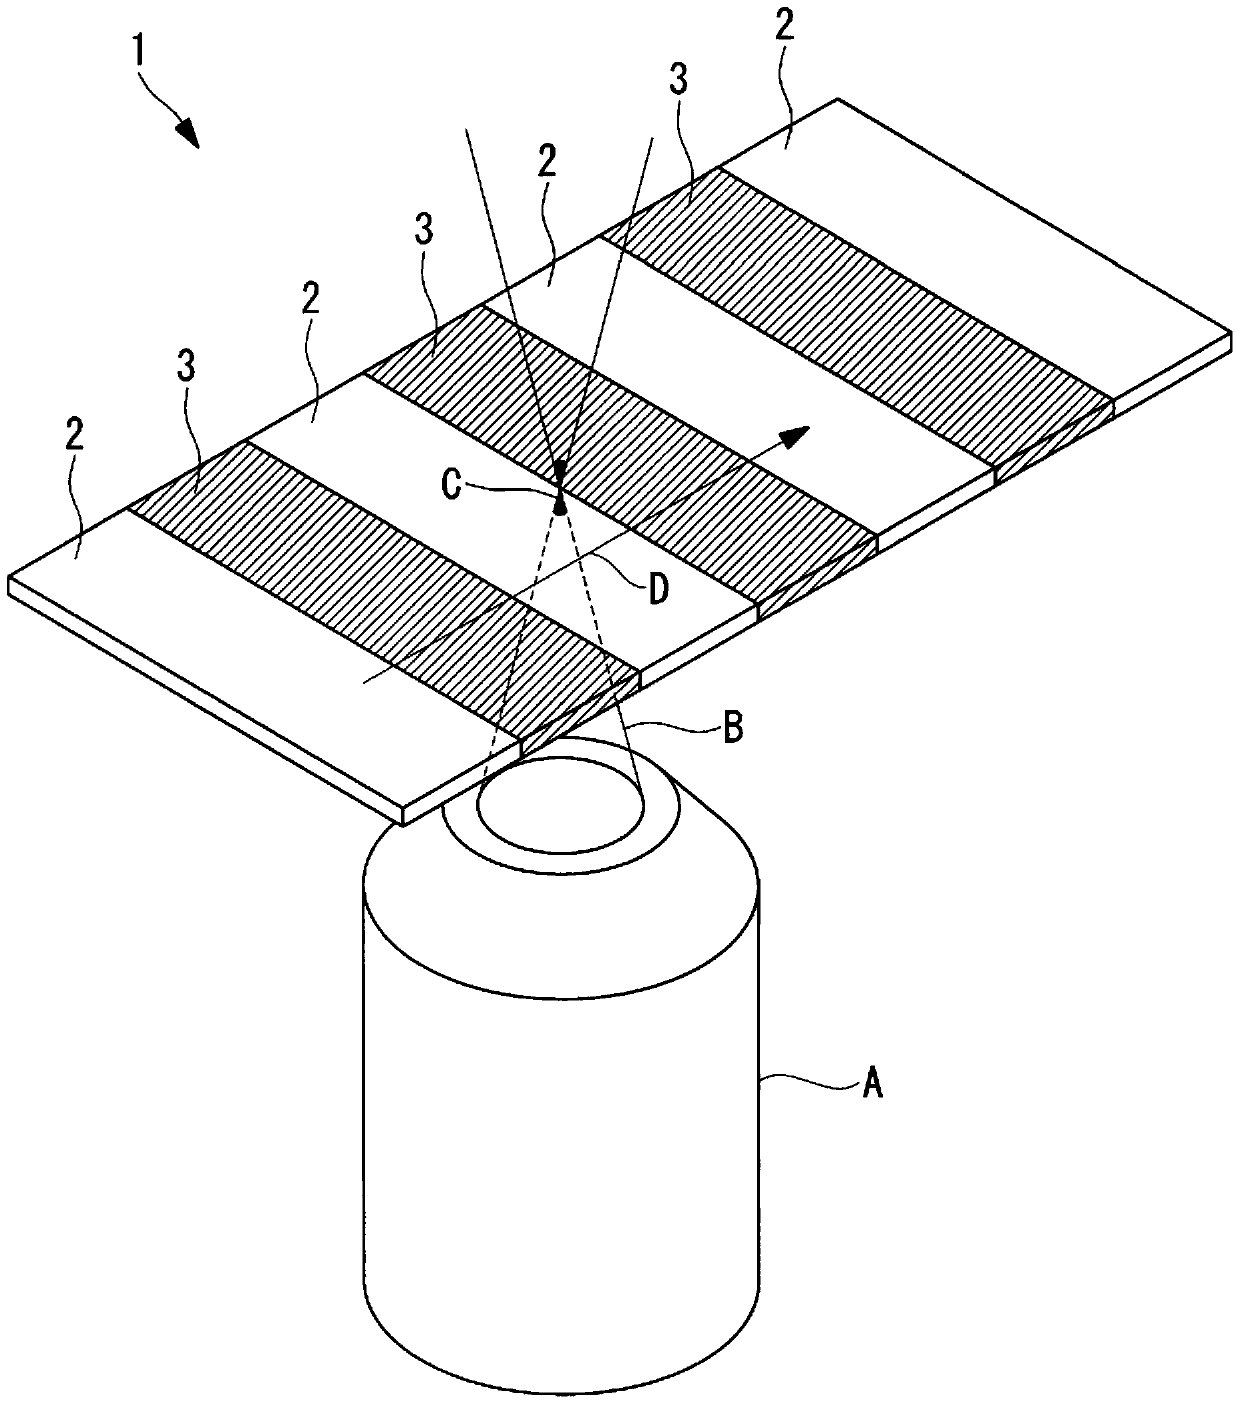
[0040] Hereinafter, an evaluation method of an optical analysis device and a phantom sample 1 according to an embodiment of the present invention will be described with reference to the drawings.

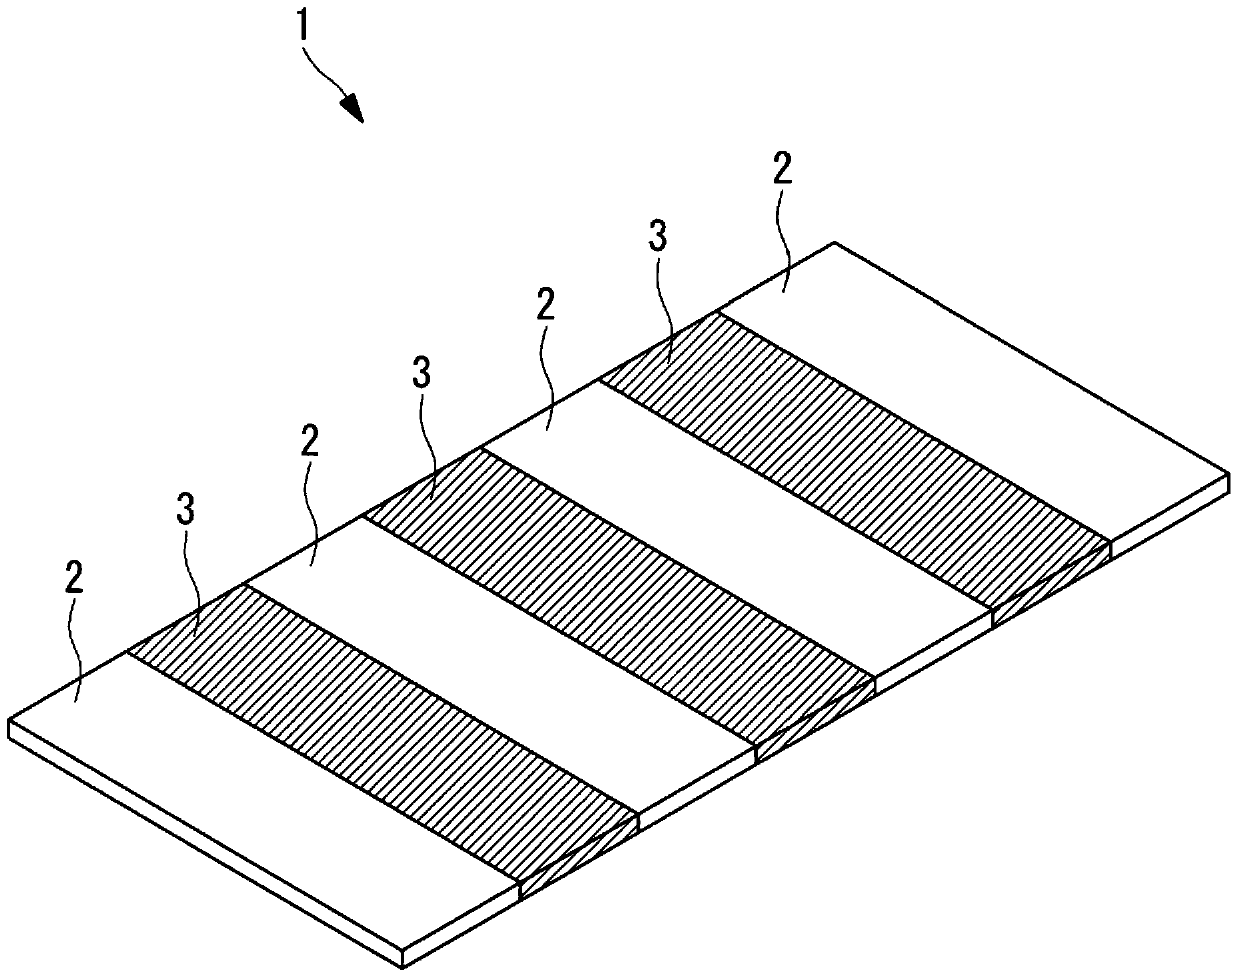
[0041] The phantom sample 1 involved in this embodiment is as figure 1 As shown, a plurality of two types of solid members 2 and 3 having different fluorescent substance concentrations are alternately adjacently arranged to form a flat plate shape.

[0042]One solid member 2 contains a fluorescent substance having a predetermined fluorescent concentration. The other solid member 3 does not contain a fluorescent substance (contains a fluorescent substance whose fluorescence concentration is zero.). These solid members 2 and 3 are formed extremely thin, and their width dimensions are set to the same width dimension with high precision.

[0043] Hereinafter, an evaluation method of an optical analysis device using the phantom sample 1 according to the present embodiment configured i...


PUM


Abstract

Evaluate the optical system of the optical analysis device easily and with high accuracy. Provided is an evaluation method of an optical analysis device provided with an optical system (A) capable of condensing excitation light B to form a confocal region (C) at a focal position, comprising the steps of: disposing A phantom sample (1) formed by adjacently arranging two or more solid members (2, 3) with different concentrations of fluorescent substances; (1) Move relatively along the arrangement direction of the solid components (2, 3), while irradiating excitation light to the phantom sample (1) through the optical system (A); detect the solid components (2) arranged in the confocal area (C) , the fluorescence generated at 3); and evaluating the optical system (A) based on the detected fluorescence.

Description

technical field [0001] The invention relates to an evaluation method of an optical analysis device and a phantom sample. Background technique [0002] Conventionally, an optical analysis device is known (for example, refer to Patent Document 1.) that can quantitatively observe phases that can be processed by optical analysis techniques including statistical processing such as fluorescence correlation spectroscopy (Fluorescence Correlation Spectroscopy: FCS). The state and characteristics of luminescent particles in an aqueous solution with a lower concentration. [0003] This optical analysis device uses an optical system capable of detecting light from a confocal region (confocal region) in an aqueous solution, such as a confocal microscope or a multiphoton excitation microscope. Then, when the position of the confocal region is moved in the aqueous solution, that is, while scanning the aqueous solution through the confocal region, it is detected that light-emitting partic...

Claims


Application Information

Patent Timeline
Patent Type & Authority Patents(China)
IPC IPC(8): G01N21/64
CPCG01N21/274G01N21/278G01N21/6458G02B21/0076G02B21/008G02B21/34G01M11/02G01N21/645G01M11/00G01N2201/06113G01N2201/127G01N2201/13G01N21/276
Inventor 山口光城
Owner OLYMPUS CORP
Learn More