
Chart display defect optimization method based on chart types and data feature scenes

A chart type and chart display technology, applied in other database browsing/visualization, electronic digital data processing, other database retrieval, etc., can solve the problems of difficulty in visual display of charts, lack of support for X-axis label management, etc., to achieve optimization The effect of the interface display effect

Active Publication Date: 2015-12-02
NANJING UNIV
View PDF4 Cites 8 Cited by
  • Summary
  • Abstract
  • Description
  • Claims
  • Application Information

AI Technical Summary

Problems solved by technology

[0007] However, in the existing technology, the common method is lack of support for X-axis label management. When the horizontal axis label is too long, the charts under highcharts will overlap due to the inability to perform adaptive rotation, even earlier Some mainstream components Fusioncharts, although improved, still cannot avoid this problem
In addition, in the histogram and line chart, the display of dataLabel will also overlap due to the increase in the number of data on the horizontal axis, resulting in difficulties in visual display of the chart

Method used

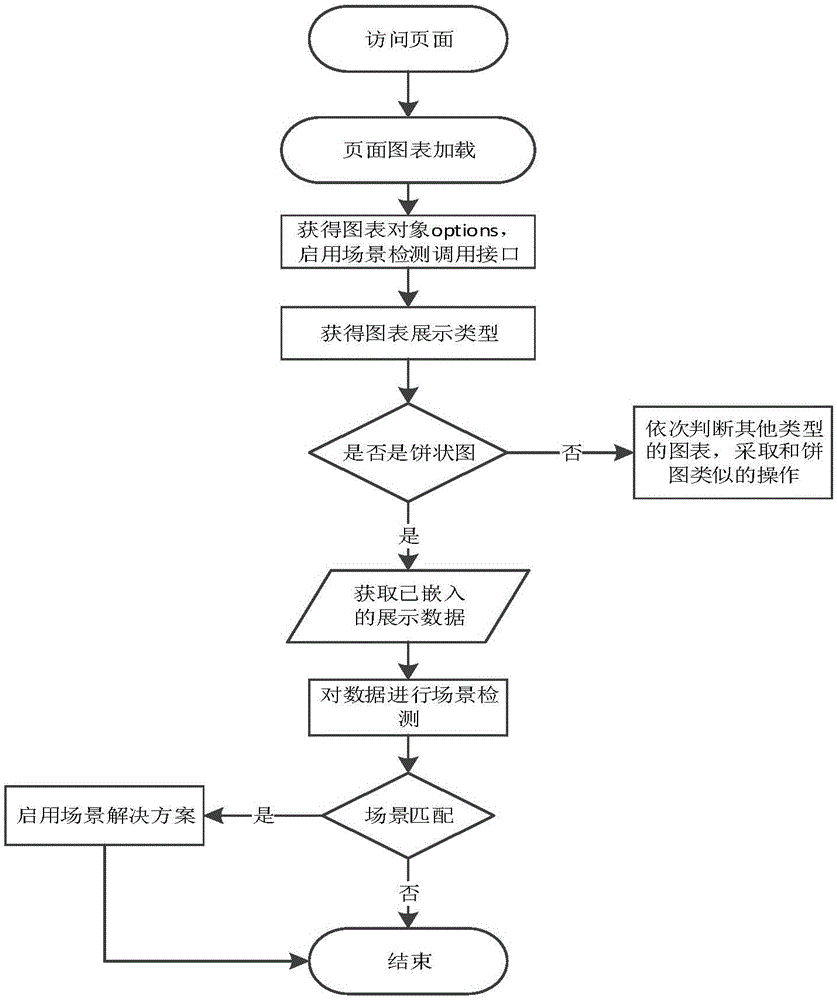
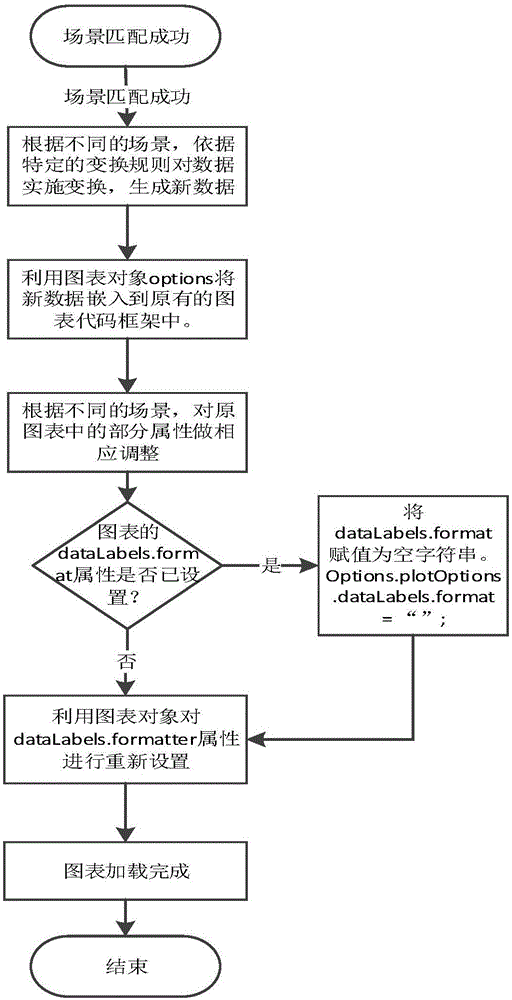
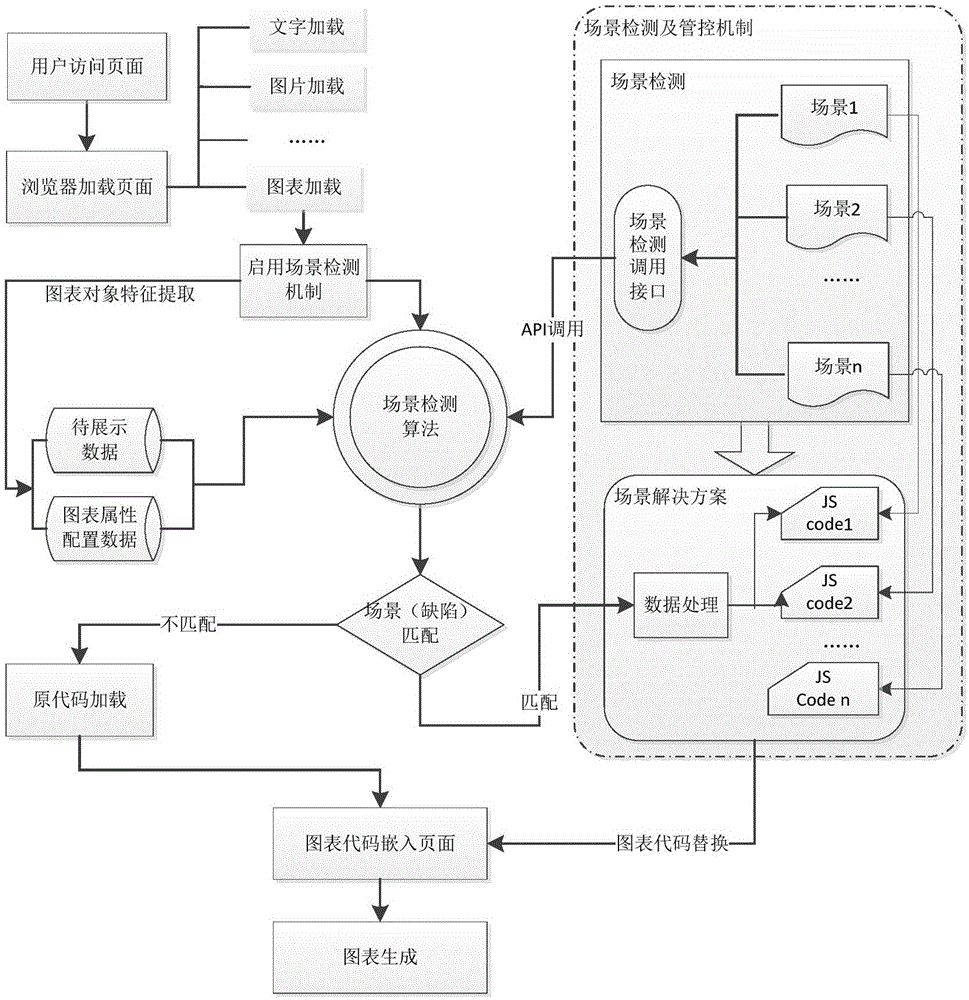

Image

  • Chart display defect optimization method based on chart types and data feature scenes
  • Chart display defect optimization method based on chart types and data feature scenes
  • Chart display defect optimization method based on chart types and data feature scenes

Examples


Embodiment Construction

[0034] Exemplary embodiments of the present disclosure will be described in more detail below with reference to the accompanying drawings. Although exemplary embodiments of the present disclosure are shown in the drawings, it should be understood that the present disclosure may be embodied in various forms and should not be limited by the embodiments set forth herein. Other embodiments may include structural, logical, electrical , process, and other changes. The examples merely represent possible variations. Rather, these embodiments are provided for more thorough understanding of the present disclosure and to fully convey the scope of the present disclosure to those skilled in the art. These embodiments of the present invention may be referred to herein individually or collectively by the term "invention", which is for convenience only and is not intended to automatically limit the scope of this application if in fact more than one invention is disclosed For any single inve...


PUM


Abstract

The invention provides a chart display defect optimization method based on chart types and data feature scenes. The method comprises the following steps of: after the loading of charts is completed, obtaining a chart generating code corresponding to the charts; calling a scene detection interface according to the chart generating code; performing scene detection according to data and the chart types of charts to be generated; determining a matched scene, and then, calling a scene solution; and optimizing the chart display defects. The method has the advantages that restoration and regulation can be fast and effectively performed on the chart display defects due to the chart types and the data features in the chart generating process; and various charts with good interface displaying are generated.

Description

technical field [0001] The invention relates to a method in the technical field of computer Web page charts, in particular to a method for optimizing chart display defects based on chart types and data characteristics. Background technique [0002] With the rapid development of network technology, websites show an explosive growth trend. According to statistics, the number of websites increases by 10 million every three months on average, including commercial websites, personal websites, corporate websites, government websites, etc. Especially for government websites and enterprise websites, in addition to personnel management, the external display of relevant data also occupies a considerable proportion. More and more pages use beautiful, intuitive, powerful, rich charts and graphics compatible with most browsers. The chart plug-in displays the chart data of the page. [0003] In the prior art, more popular web chart graphics plug-ins include Highcharts, echarts, fusioncha...

Claims


Application Information

Patent Timeline
Patent Type & Authority Applications(China)
IPC IPC(8): G06F17/30G06F9/44
CPCG06F9/4482G06F16/904
Inventor 胡昊瞿萍朱明吕建单苏苏
Owner NANJING UNIV
Learn More