Display method of network data and apparatus thereof

A technology for network data and content, applied in the field of data processing, can solve problems such as reducing the efficiency and accuracy of event propagation analysis, and achieve the effect of optimizing visual display technology

Active Publication Date: 2017-01-18
BAIDU ONLINE NETWORK TECH (BEIJIBG) CO LTD
View PDF5 Cites 16 Cited by
  • Summary
  • Abstract
  • Description
  • Claims
  • Application Information

AI Technical Summary

Problems solved by technology

[0003] At present, there are many methods for the collection of raw data and the extraction of users through which events spread and diffuse, but using algorithms to save the results in t...

Method used


Image

  • Display method of network data and apparatus thereof
  • Display method of network data and apparatus thereof
  • Display method of network data and apparatus thereof

Examples


no. 1 example

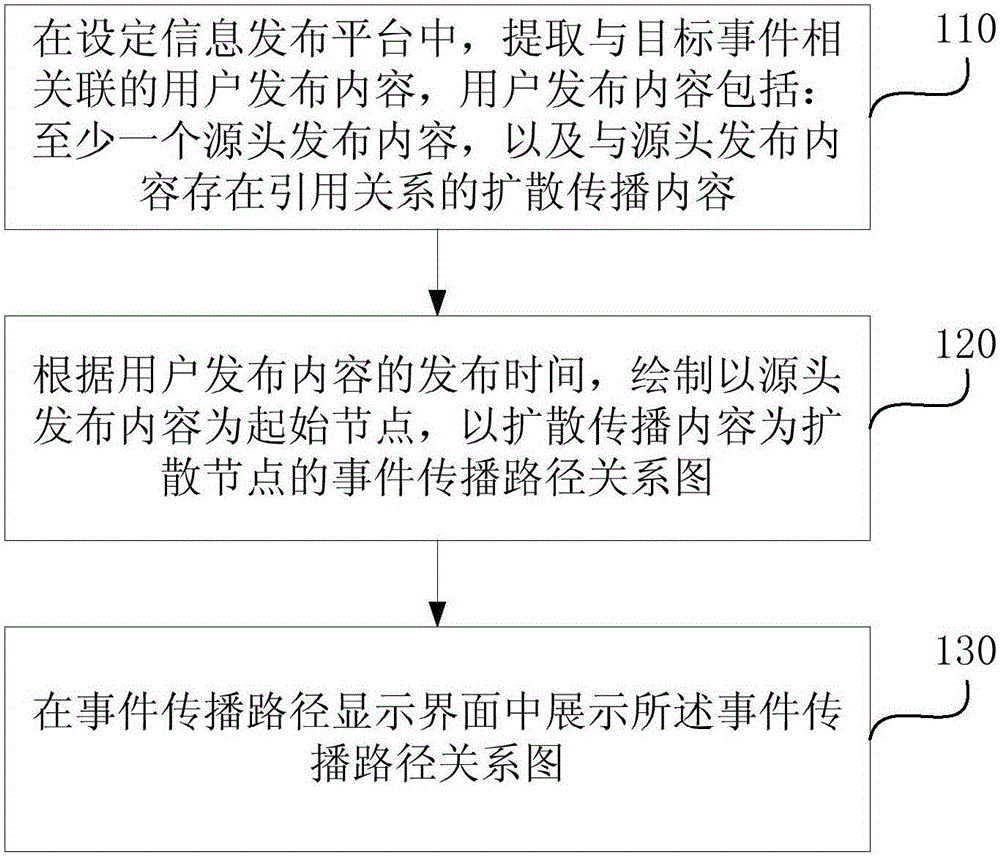
[0030] figure 1 This is a flowchart of a method for displaying network data provided by the first embodiment of the present invention. The method in this embodiment can be executed by a device for displaying network data, which can be implemented by hardware and / or software, and generally Can be integrated in a server, the method of this embodiment specifically includes:

[0031] 110. In the setting information publishing platform, extract user published content associated with the target event.

[0032] In this embodiment, the set information publishing platform refers to various social network platforms on which users can post personal opinions, such as information publishing platforms such as Weibo, WeChat, Tieba, Tianya, or schoolnet.

[0033] The target event refers to a hot event or emergency event that needs to study or monitor its spread and spread.

[0034] Optionally, the user-published content associated with the target event can be extracted in the set information publishi...

no. 2 example

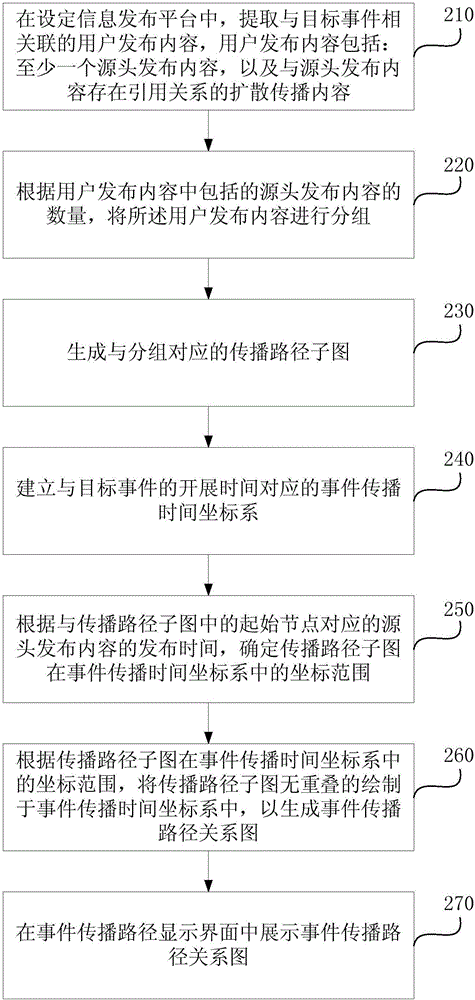
[0050] Figure 2a It is a flowchart of a method for displaying network data provided by the second embodiment of the present invention. This embodiment is optimized on the basis of the above-mentioned embodiment. In this embodiment, according to the release time of the user-published content, the source-published content is drawn as the starting node, and the spreading content is the spreading node. The optimization of the event propagation path relationship diagram of the user-published content is: grouping the user-published content according to the amount of source-published content included in the user-published content; generating a sub-graph of the propagation path corresponding to the grouping; establishing a connection with the target The event propagation time coordinate system corresponding to the development time of the event; the propagation time coordinate system of the propagation path subgraph in the event is determined according to the publication time of the sou...

no. 3 example

[0096] Figure 3a It is a flowchart of a method for displaying network data provided by the third embodiment of the present invention. This embodiment is optimized on the basis of the above-mentioned embodiment. In this embodiment, after extracting the user-posted content associated with the target event in the setting information release platform, it also preferably includes: User-published content is grouped by time, and the number of user-published contents under different time groups is counted;

[0097] Correspondingly, according to the release time of the user-published content, the event propagation path relationship diagram with the source-published content as the starting node and the diffusion propagation content as the diffusion node will be further optimized as follows: In the time coordinate system, the quantity value of the user-published content under the different time groups is drawn in a vertical line;

[0098] Correspondingly, the method of this embodiment speci...


PUM


Abstract

Embodiments of the invention disclose a display method of network data and an apparatus thereof. The method comprises the following steps of in an information issuing platform, extracting a user issuing content associated with a target event, wherein the user issuing content includes at least one source issuing content and a diffusion spreading content which has a reference relationship with the source issuing content; according to issuing time of the user issuing content, drawing an event spreading path relation graph which takes the source issuing content as an initial node and takes the diffusion spreading content as a diffusion node; displaying the event spreading path relation graph in an event spreading path relation graph. In the technical scheme of the invention, the user issuing content is served as a node, a spreading diffusion path of an event and time information are combined and displayed, a technical effect of visually displaying an evolution process of the event along with time is achieved, an existing visualization display technology of network data is optimized and a user can simply, visually and effectively acquire a spreading diffusion condition of an event content.

Description

Technical field [0001] The embodiment of the present invention relates to data processing technology, in particular to a method and device for displaying network data. Background technique [0002] With the continuous development of Internet technology, Internet users can more and more conveniently publish and forward personal speech in various online media. The number of speeches made by netizens on the Internet also reflects the heat of the incident to a certain extent. How to discover how hot events occurred from the massive data, when to which users as the source began to explode and spread rapidly, and how the opinion leaders behind the event dissemination played a role have become the key issues in the analysis of network event dissemination. [0003] At present, there are many methods for the collection of raw data and the extraction of users through the spread of events. However, algorithms are used to save the results in traditional methods such as lists and texts. Manual ...

Claims


Application Information

Patent Timeline
IPC IPC(8): H04L12/24
CPCH04L41/12H04L41/22
Inventor 车丽美黄伟范涛李炫沈剑平莫洋
Owner BAIDU ONLINE NETWORK TECH (BEIJIBG) CO LTD
Why Eureka
Try Eureka