Method and system for realizing scatter plot function

A scatter plot and function technology, applied in other database retrieval, extraction from basic elements, other database browsing/visualization, etc. Effect

Active Publication Date: 2019-09-27
GUANGDONG SHUNDE IND DESIGN INST GUANGDONG SHUNDE INNOVATIVE DESIGN INST
View PDF4 Cites 0 Cited by
  • Summary
  • Abstract
  • Description
  • Claims
  • Application Information

AI Technical Summary

Problems solved by technology

Generally, when drawing a scatterplot, there are as few as hundreds of thousands of data points, and as many as tens of millions of data points. Using the traditional method of drawing scatterplots, the software is prone to freezes, even downtime, and When the amount of data increases, the effect of the drawn scatter plot cannot be distinguished with the naked eye. Therefore, the traditional method of realizing the function of the scatter plot has low definition of drawing

Method used


Image

  • Method and system for realizing scatter plot function
  • Method and system for realizing scatter plot function

Examples


Embodiment Construction

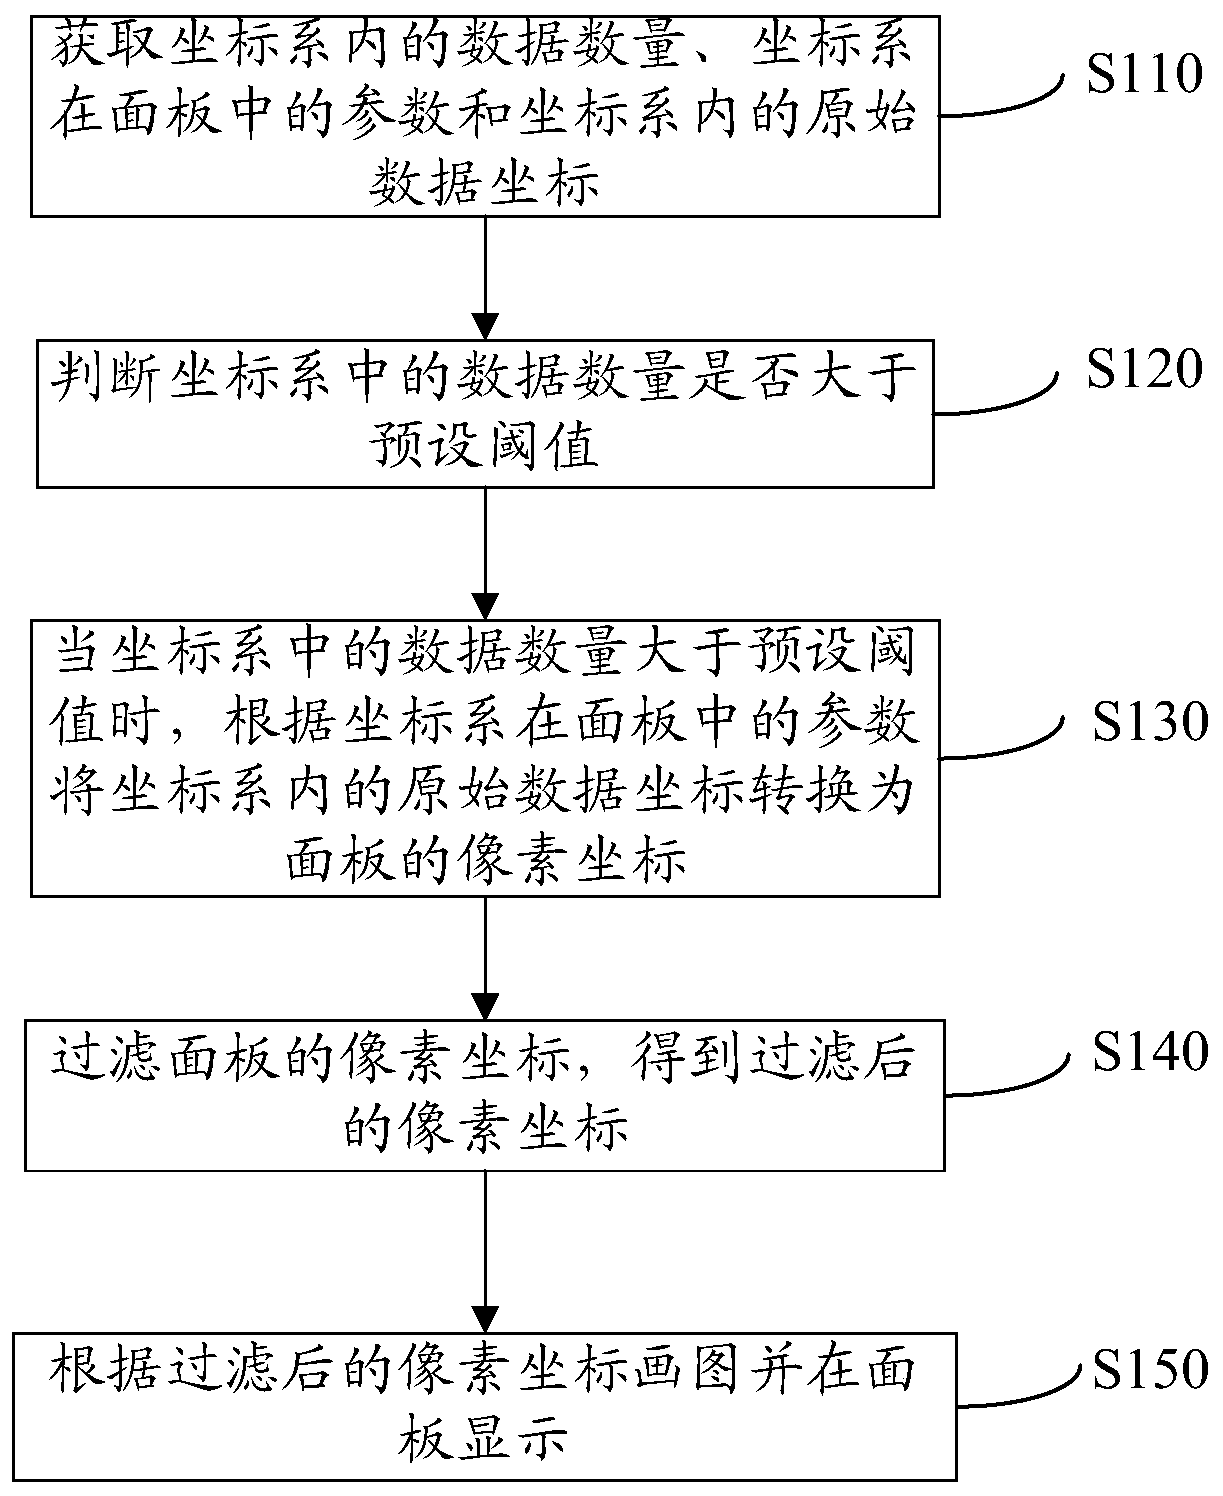
[0019] In one embodiment, such as figure 1 As shown, a method for realizing the function of the scatter plot includes the following steps:

[0020] Step S110: Obtain the amount of data in the coordinate system, the parameters of the coordinate system in the panel, and the coordinates of the original data in the coordinate system.

[0021] Specifically, the parameters of the coordinate system in the panel include the initial coordinate of the coordinate system in the panel, the width of the coordinate system, the height of the coordinate system, the minimum scale of the coordinate system abscissa, the maximum scale, and the minimum scale and maximum scale.

[0022] Step S120: Determine whether the amount of data in the coordinate system is greater than a preset threshold.

[0023] Specifically, according to the use of direct drawing without data filtering, the phenomenon of operating graphics freezes, according to the current test, when the amount of data is greater than 1 mi...


PUM


Abstract

The invention relates to a method and system for implementing scatter diagram function; data quantity of a coordinate system, parameters of the coordinate system in a panel and original data coordinates in the coordinate system are acquired; whether the data quantity in the coordinate system is greater than a preset threshold or not is judged; when the data quantity of the coordinate system is greater than the preset threshold, the original data coordinates in the coordinate system are converted into pixel coordinates of the panel according to the parameters of the coordinate system in the panel; the pixel coordinates of the panel are filtered to obtain filtered pixel coordinates; a diagram is drawn according to the filtered pixel coordinates and displayed on the panel. When the data quantity of the coordinate system is greater than a preset threshold, the original data coordinates in the coordinate system are converted into pixel coordinates of the panel; approximately equal pixel coordinates are filtered to reduce the data quantity; a diagram is drawn according to the filtered pixel coordinates; the acquired diagram never distorts and is highly vivid.

Description

technical field [0001] The invention relates to the field of scatter plots, in particular to a method and system for realizing the function of scatter plots. Background technique [0002] With the development of digital PCR, data processing in software has also shown exponential growth, from hundreds of thousands to tens of millions of data. Generally, when drawing a scatterplot, there are as few as hundreds of thousands of data points, and as many as tens of millions of data points. Using the traditional method of drawing scatterplots, the software is prone to freezes, even downtime, and When the amount of data increases, the effect of the drawn scatter plot cannot be distinguished with the naked eye. Therefore, the traditional method for realizing the function of the scatter plot has low definition of drawing. Contents of the invention [0003] Based on this, it is necessary to provide a method and system for realizing the function of scatter plots with high drawing def...

Claims


Application Information

Patent Timeline
Patent Type & Authority Patents(China)
IPC IPC(8): G06F16/904G06T11/20
Inventor 陈俊璘廖丽敏徐秀莉师伟展
Owner GUANGDONG SHUNDE IND DESIGN INST GUANGDONG SHUNDE INNOVATIVE DESIGN INST
Why Eureka
Try Eureka