Eureka AIR delivers breakthrough ideas for toughest innovation challenges, trusted by R&D personnel around the world.

Air fine particle numerical value display method

A fine particle and numerical technology, applied in the field of air fine particle numerical display, can solve problems such as disturbing school teaching order, not being able to objectively reflect the impact of air quality on human health, and achieve the effect of avoiding unnecessary worries

Inactive Publication Date: 2017-10-03
北京新风到家科技有限公司
View PDF5 Cites 1 Cited by
  • Summary
  • Abstract
  • Description
  • Claims
  • Application Information

AI Technical Summary

Problems solved by technology

[0002] The existing PM2.5 value display method is that the PM2.5 detector outputs the signal to the cloud, and the cloud pushes the real-time detection data to a large display screen (such as a school’s display screen) or transmits it to the user’s mobile terminal (such as a student’s parent) through the network. mobile terminal), the displayed PM2.5 value is the actual detection value at the current detection time. The disadvantage of this display method is that it cannot objectively reflect the impact of indoor air quality on human health. The total amount of inhaled PM2.5 has a direct impact on health. For example, when there are no people in a room, poor air quality will not affect human health. Air purification is performed before people enter the room. The quality has always been excellent. When the room opens the entrance door, dirty air may enter instantly, but the PM2.5 value at this time cannot truly reflect the impact of indoor air quality on human health, and it is easy to cause users to worry about indoor air quality. Especially when it is used to monitor the air quality of school classrooms, it is more likely to cause parents of students to judge the overall air quality of the school based on the instantaneous value, causing unnecessary worries, which may interfere with the normal teaching order of the school

Method used


Image

  • Air fine particle numerical value display method
  • Air fine particle numerical value display method

Examples


Embodiment 1

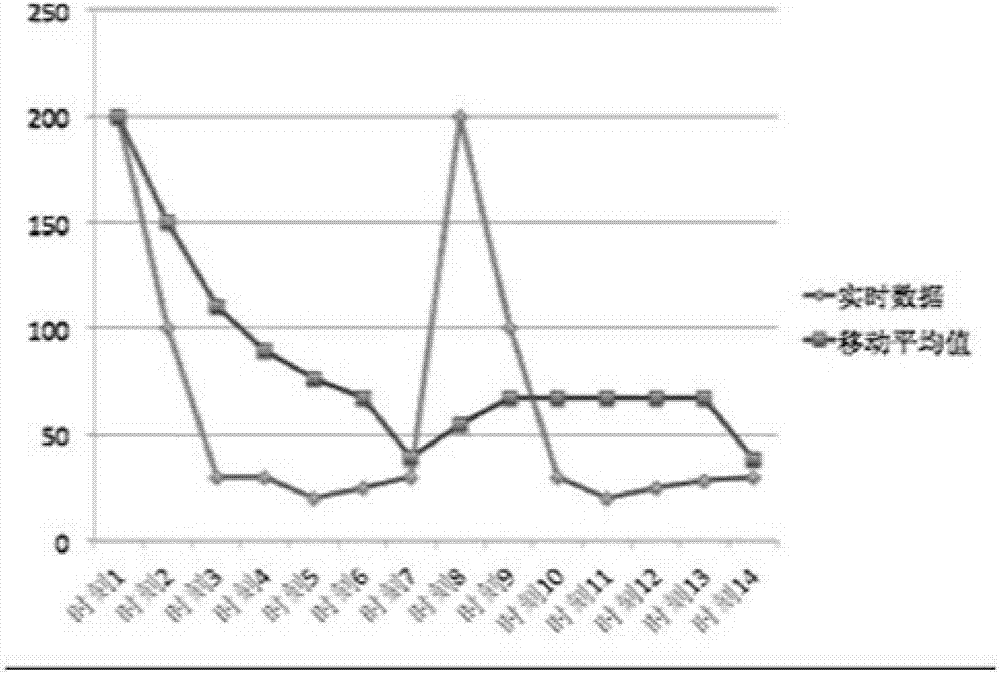
[0018] Example 1: Simple Moving Average Algorithm

[0019] The formula for calculating the moving average is as follows:

[0020] Dt=(At+At-1+At-2+At-3+...+At-n-1) / n,

[0021] In the formula, Dt represents the currently displayed PM2.5 value; n represents the number of moving average moments; At represents the actual detection value at the current detection time, At-1 represents the actual detection value at the previous detection time; At-2 represents the previous 2 The actual detection value at the detection time, At-3 represents the actual detection value at the previous 3 detection time; At-n-1 represents the previous n -1 The actual detection value at the detection moment.

[0022] The time interval of each detection moment is the same, in this embodiment, the time interval is 10 minutes, and the value of n is 6. In the first calculation cycle, the values ​​of n are 2, 3, 4, 5, and 6 in sequence.

[0023] The real-time detected PM2.5 data and the PM2.5 displayed data ...

Embodiment 2

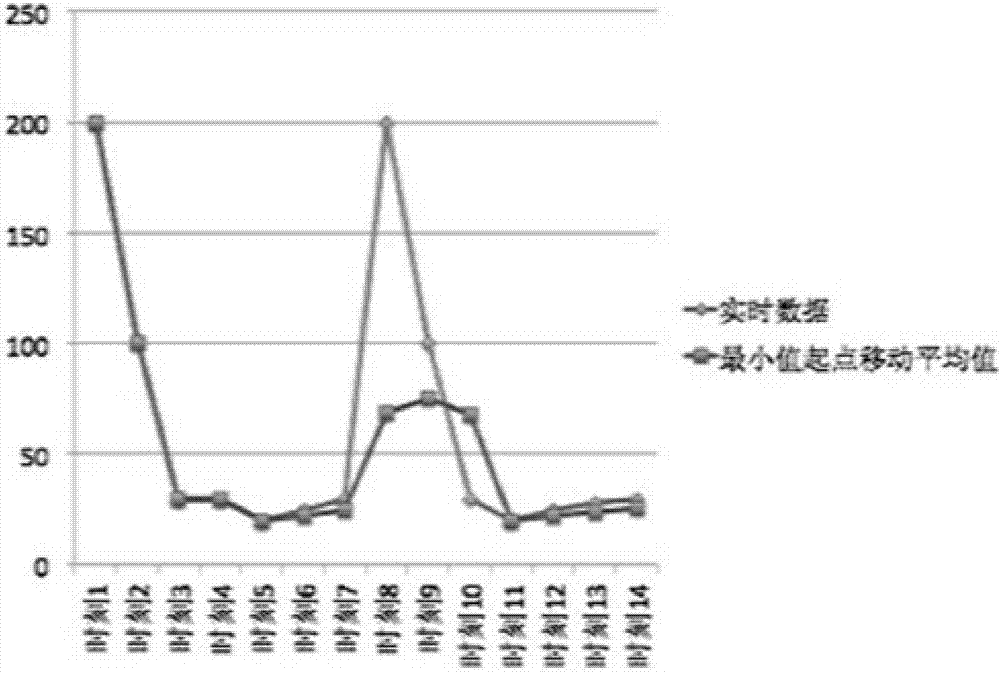
[0026] Embodiment 2: Minimum starting point moving average algorithm

[0027] When the At value is the smallest among At, At-1, At-2, At-3...At-n-1, then Dt=At, and at the same time use the At value as the starting point for the new moving average calculation, that is, the next The PM2.5 display value at the detection time is

[0028] Dt i+1 =(At i+1 +At i+1 -1) / 2, where, Dt i+1 is the PM2.5 display value at the next detection moment, At i+1 is the actual detection value at the next detection moment, At i+1 -1=At; if not, continue with simple moving average algorithm.

[0029] The real-time detected PM2.5 data and the displayed PM2.5 data are shown in Table 2, the real-time detected PM2.5 data and the PM2.5 displayed data schematic diagram, as shown in figure 2 shown.

[0030] Table 2

[0031] time


PUM


Abstract

The invention relates to an air fine particle numerical value display method. A PM2.5 detector transmits real-time detection data to a cloud server. The method is characterized by that the PM2.5 detector transmits the real-time detection data to the cloud server through a network, the cloud server calculates a current PM2.5 display numerical value according to the real-time detection data, and the cloud server sends the current PM2.5 display numerical value to a display big screen or a mobile terminal through the network.

Description

technical field [0001] The invention relates to a method for displaying numerical values ​​of air fine particles. Background technique [0002] The existing PM2.5 value display method is that the PM2.5 detector outputs the signal to the cloud, and the cloud pushes the real-time detection data to a large display screen (such as a school’s display screen) or transmits it to the user’s mobile terminal (such as a student’s parent) through the network. mobile terminal), the displayed PM2.5 value is the actual detection value at the current detection time. The disadvantage of this display method is that it cannot objectively reflect the impact of indoor air quality on human health. The total amount of inhaled PM2.5 has a direct impact on health. For example, when there are no people in a room, poor air quality will not affect human health. Air purification is performed before people enter the room. The quality has always been excellent. When the room opens the entrance door, dirt...

Claims


Application Information

Patent Timeline
Patent Type & Authority Applications(China)
IPC IPC(8): H04L29/08G01N15/06
CPCH04L67/10G01N15/06
Inventor 姜天露
Owner 北京新风到家科技有限公司
Why Eureka
Eureka Blog
Learn More