Visual configuration data acquisition system implementation method

A collection system and implementation method technology, applied in the field of data visualization, to achieve the effect of improving configuration efficiency, reducing the number of acquisitions, and increasing system stability

Inactive Publication Date: 2017-11-24
威创软件南京有限公司
View PDF7 Cites 4 Cited by
  • Summary
  • Abstract
  • Description
  • Claims
  • Application Information

AI Technical Summary

Problems solved by technology

[0006] The purpose of the present invention is to provide a method for implementing a visually configured data acquisition system, which solves the problem of obtaining data from different data sources and displaying them on the display platform as needed

Method used


Image

  • Visual configuration data acquisition system implementation method

Examples


Embodiment Construction

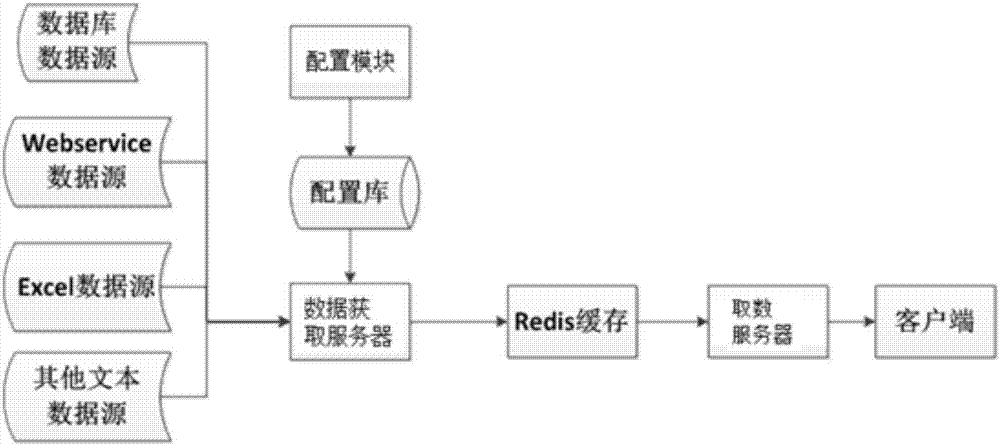
[0020] Such as figure 1 A method for implementing a visually configured data acquisition system shown includes the following steps:

[0021] Step 1: Establish a data acquisition module for obtaining data sources, and establish a configuration module for configuring data sources. The configuration module includes a configuration library and a configuration server. The configuration server configures indicators for all data sources. The indicators are combined with data sources, A fetching statement or an interface is used to fetch the flag value of specific data, and the flag value is a data table or a single value;

[0022] The configuration server configures corresponding indicator parameters for all indicators, and configures one or more indicator parameters for the same indicator. The indicator parameters are variables used to store variable data, and are used to map and retrieve the same indicator under different filter conditions;

[0023] The configuration library is us...


PUM


Abstract

The invention discloses a visual configuration data acquisition system implementation method, and belongs to the technical field of data visualization. The method comprises the steps that indexes and index parameters are configured for a data source, the indexes are bound to component modules, the indexes configured in a scene are added into a task queue of an access server, and finally a data obtaining module obtains data according to the configured indexes. Accordingly, the data source configuration efficiency can be improved, and the indexes are subjected to once configuration and can be called by multiple components; a data distribution technology is adopted, each index obtains the data and then is distributed to the component module using the index, the obtaining frequency of the index from the data source is reduced, the obtaining efficiency is improved, only the indexes with the bound component modules can be called, and the index without the bound component modules cannot be executed; a Redis caching technology is adopted, when data obtaining fails, caching data can be used, and the system stability is increased.

Description

technical field [0001] The invention belongs to the technical field of data visualization, and in particular relates to a method for realizing a visualization configuration data collection system. Background technique [0002] The data visualization system needs to extract third-party data to the client, and then the client uses visualization components to display it on the large screen for decision analysis. The data displayed on the large screen may come from different business systems. Data from different business systems is extracted locally, analyzed and processed, and then displayed on the large screen. [0003] The deficiencies in the prior art are: [0004] 1: Configure the connected data source in the configuration file. A system can only connect to one data source, and the data can only be fetched from this data source when displayed on a large screen. [0005] 2: Multiple data sources can be connected. When a data set is displayed in multiple places, it needs to...

Claims


Application Information

Patent Timeline
Patent Type & Authority Applications(China)
IPC IPC(8): G06F17/30H04L29/06
CPCG06F16/248H04L67/01
Inventor 赵勇
Owner 威创软件南京有限公司
Why Eureka
Try Eureka