
Method and device for drawing gesture center on graph

A technology of charts and gestures, which is applied in the field of financial bills, can solve problems such as uncertain success of clicking and difficult to click accurately, and achieve the effect of improving the user experience

Inactive Publication Date: 2019-12-31
WUHAN NOTE EXCHANGE CENT CO LTD
View PDF6 Cites 0 Cited by
  • Summary
  • Abstract
  • Description
  • Claims
  • Application Information

AI Technical Summary

Problems solved by technology

On the one hand, it is not easy to accurately click a certain point on the data line of the market chart; on the other hand, after clicking, it is not sure whether the click is successful

Method used


Image

  • Method and device for drawing gesture center on graph
  • Method and device for drawing gesture center on graph
  • Method and device for drawing gesture center on graph

Examples


Embodiment Construction

[0022] The principles and features of the present invention are described below in conjunction with the accompanying drawings, and the examples given are only used to explain the present invention, and are not intended to limit the scope of the present invention.

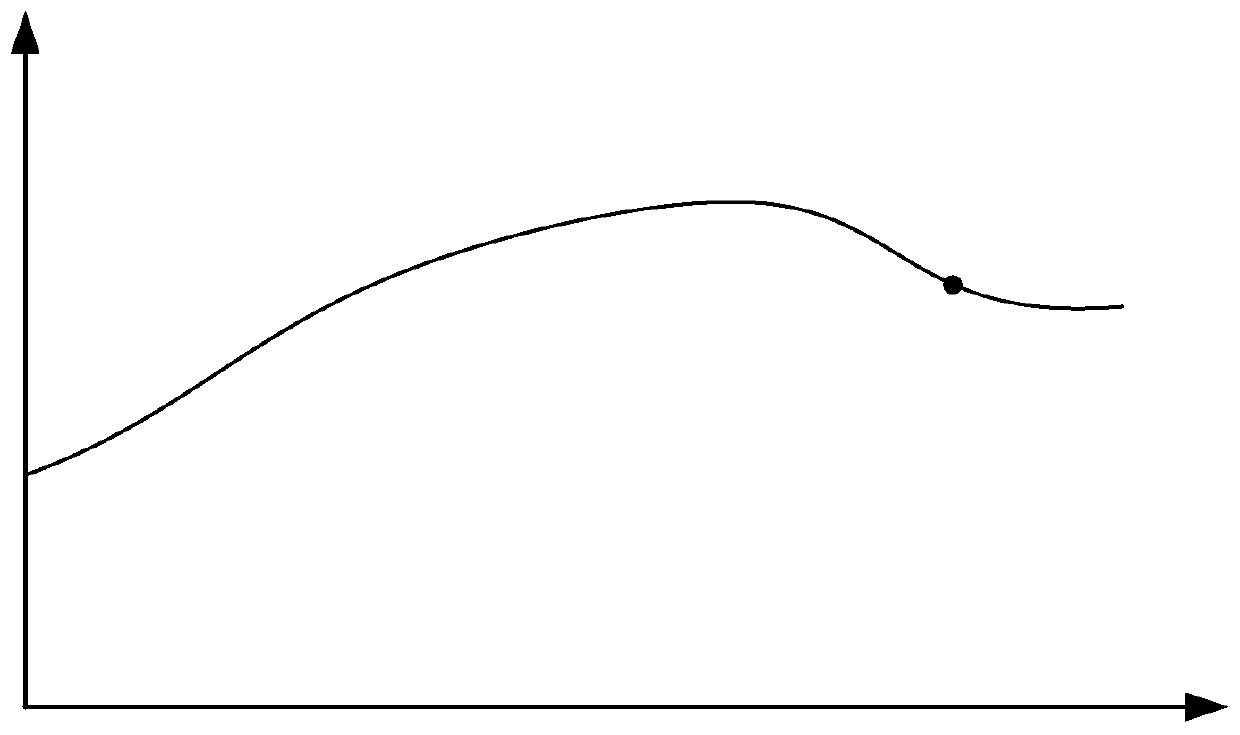
[0023] figure 1 It is a schematic diagram of the effect of selecting data points on the chart through gesture operation in the prior art. Such as figure 1 As shown in , only when a data point on the data line is selected by gesture operation, the corresponding display will be displayed. It should be noted that the actual data points are not shown enlarged, figure 1 In order to illustrate the situation, the selected data points are enlarged. Since a data point is displayed, and the display screen of a general mobile device client is small, it is not easy to determine whether the data point is selected, nor is it easy to see the selected data point clearly.

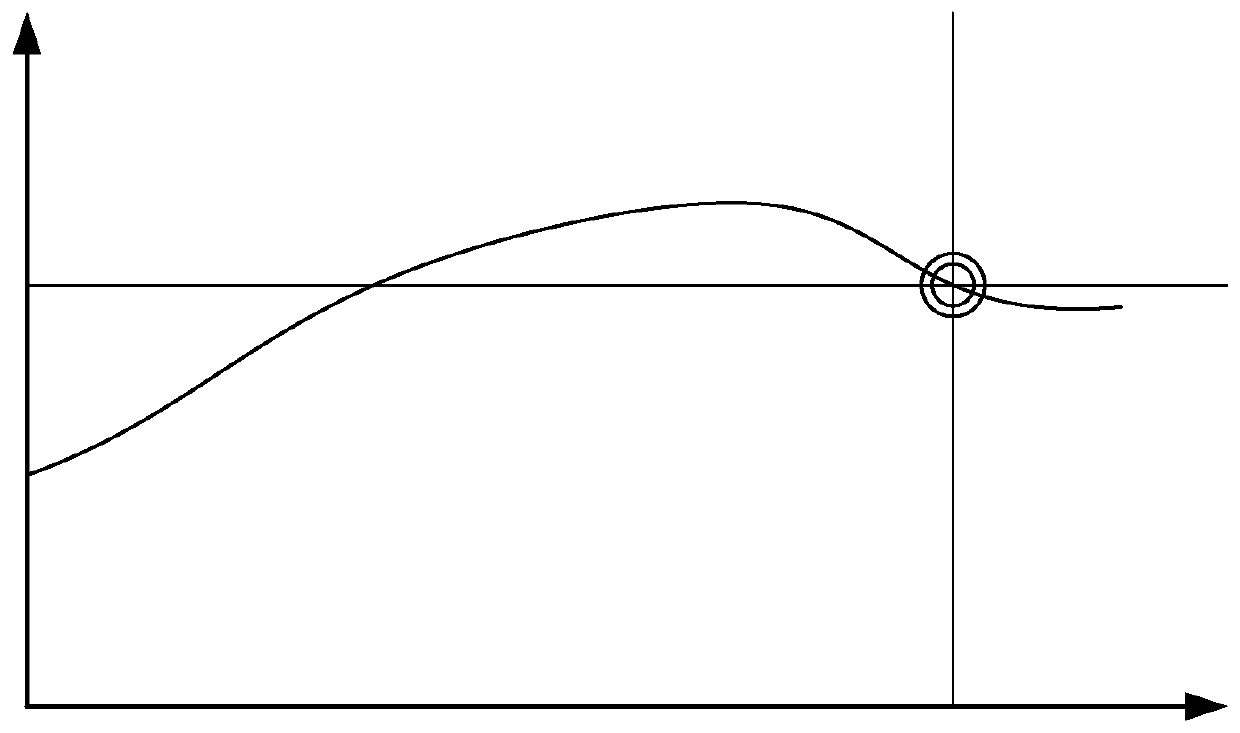
[0024] figure 2 It is a schematic diagram of the effe...


PUM


Abstract

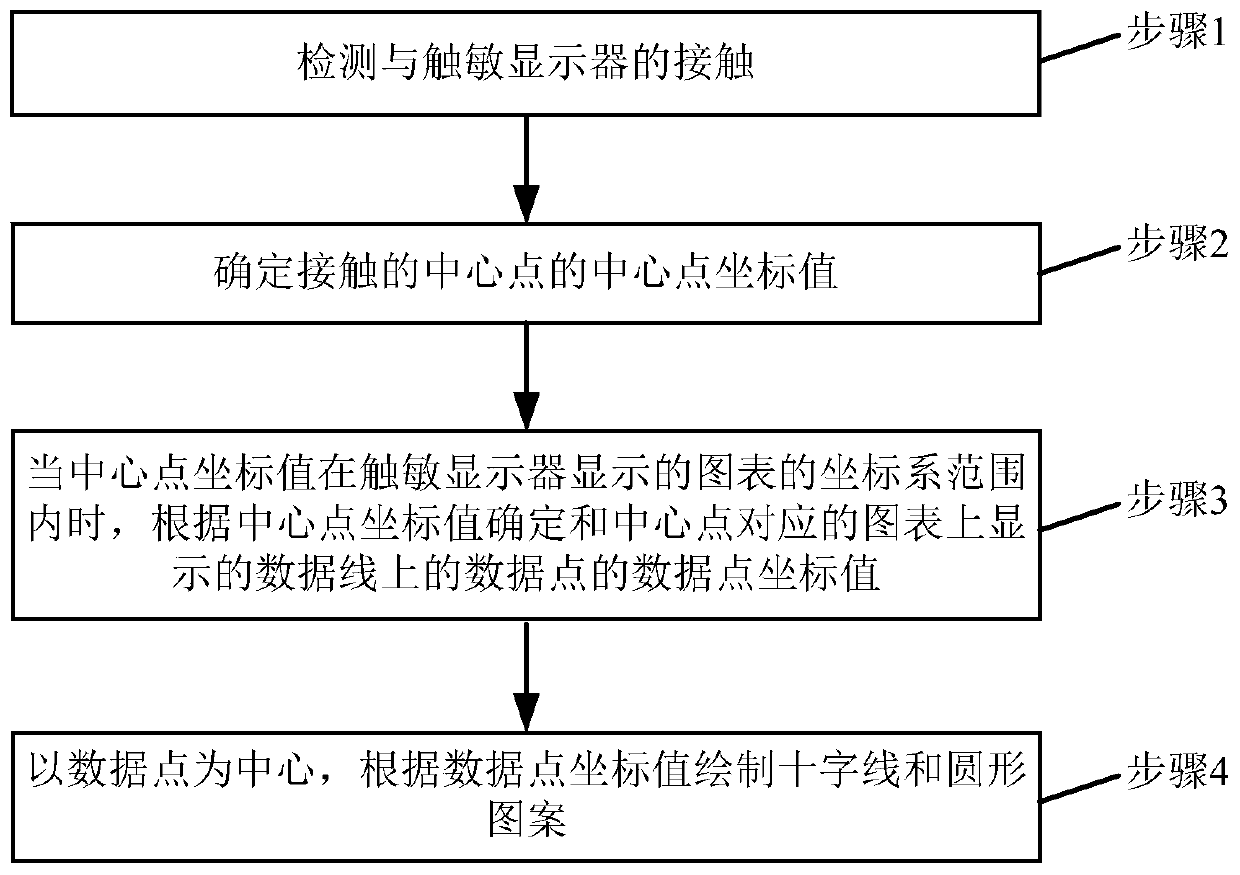
The invention relates to a gesture center drawing method and device on a chart. The method comprises the steps of detecting a contact with a touch-sensitive display, determining central point coordinate values of a center point of the contact, when the central point coordinate values are within the coordinate system of the chart displayed by the touch-sensitive display, determining data point coordinate values of a data point on a data line displayed on the chart which corresponds to the center point, according to the determined center point coordinate values, and drawing a cross line and a circular pattern according to the data point coordinate values. According to the technical scheme, a user is facilitated to select a required data point in the chart of the touch-sensitive display by means of a gesture operation, and the use experience of the user is enhanced.

Description

technical field [0001] The invention relates to the technical field of financial notes, in particular to a method and device for drawing a gesture center on a graph. Background technique [0002] For market trading apps, it is necessary to grasp the changes in market charts in real time. The quotation data and other information at different time points are generally displayed on the market chart in the form of continuous lines. If you need to know the data information at a certain time, you need to click on the corresponding data point. Currently, on the mobile terminal, the graph is mainly operated through gestures, and the contact area between the finger and the screen is relatively large. On the one hand, it is not easy to accurately click on a certain point on the data line of the market chart; on the other hand, after clicking, it is not sure whether the click is successful. Contents of the invention [0003] The present invention provides a method and device for dr...

Claims


Application Information

Patent Timeline
Patent Type & Authority Patents(China)
IPC IPC(8): G06F3/0488G06F3/0484
CPCG06F3/04842G06F3/04883
Inventor 方敏
Owner WUHAN NOTE EXCHANGE CENT CO LTD
Learn More