Visual display method for Internet public opinion map

An Internet and public opinion technology, applied in the field of Internet public opinion map visualization, can solve the problems of not showing the changing laws of public opinion, not directly reflecting the degree of reflection, and not having the geographical distribution of public opinion.

Inactive Publication Date: 2018-02-16
SOUTHWESTERN UNIV OF FINANCE & ECONOMICS
View PDF13 Cites 8 Cited by
  • Summary
  • Abstract
  • Description
  • Claims
  • Application Information

AI Technical Summary

Problems solved by technology

However, for these public opinion systems, most of their display of public opinion only uses words or statistical rules to illustrate and display, and does not directly reflect the degree of reflection of the same public opinion in different regions, or does not directly show the degree of public opinion. Geographical distribution, let alone a panoramic display of the changing law of public opinion and making corresponding predictions through geographical distribution

Method used


Image

  • Visual display method for Internet public opinion map
  • Visual display method for Internet public opinion map
  • Visual display method for Internet public opinion map

Examples


Embodiment Construction

[0030] In order to have a clearer understanding of the technical features, purposes and effects of the present invention, the specific implementation manners of the present invention will now be described with reference to the accompanying drawings.

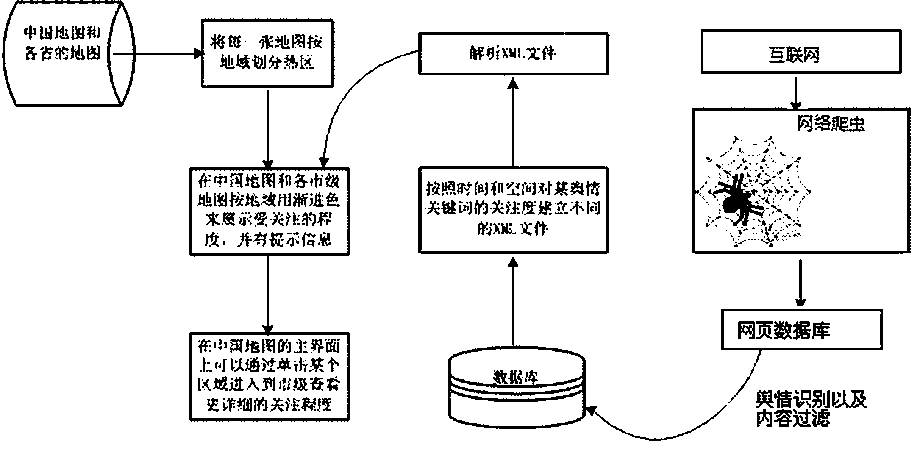
[0031] A method for visually displaying Internet public opinion maps proposed by the present invention comprises the following steps,

[0032] S1: Construct public opinion information database;

[0033] S2: According to the public opinion information database, an XML database file is established to generate XML files of geographical distribution of public opinion at different times for different events;

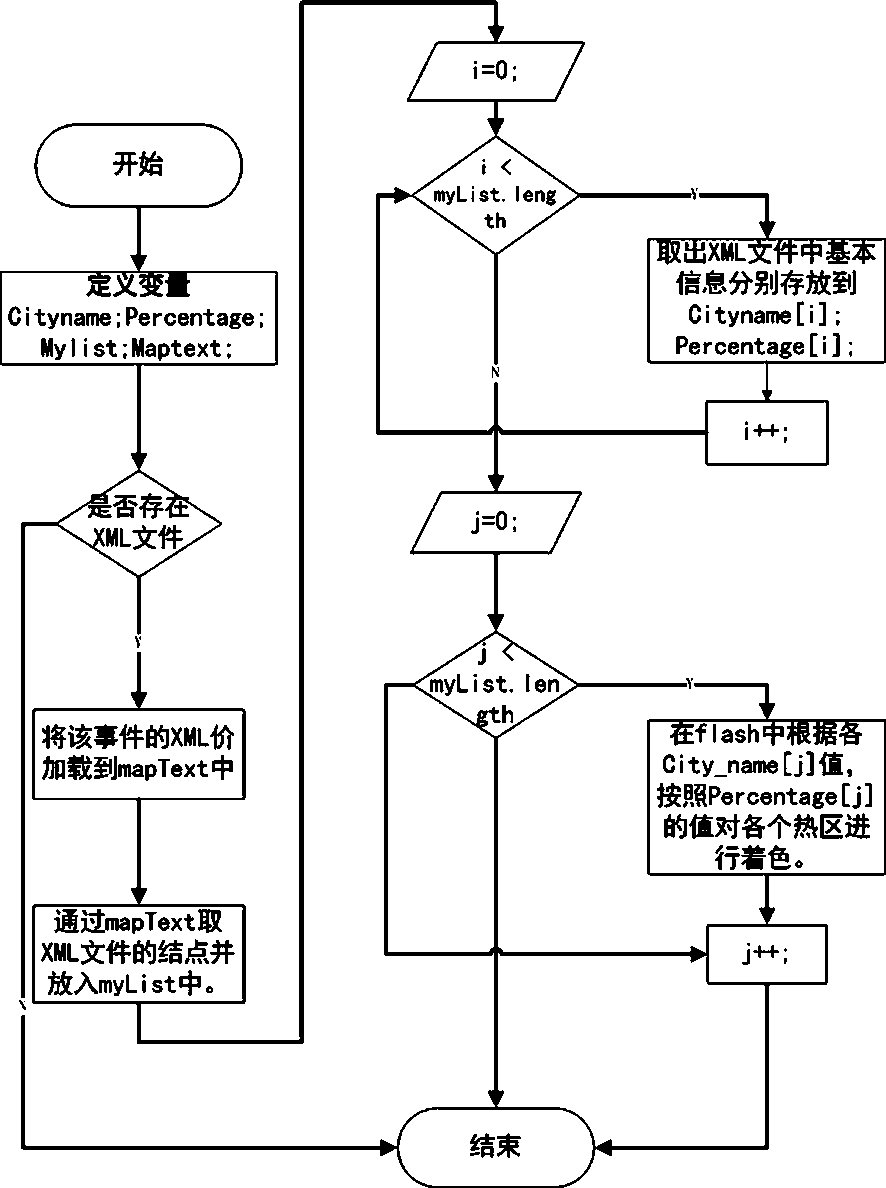
[0034] S3: Use flash files to call specific XML database files;

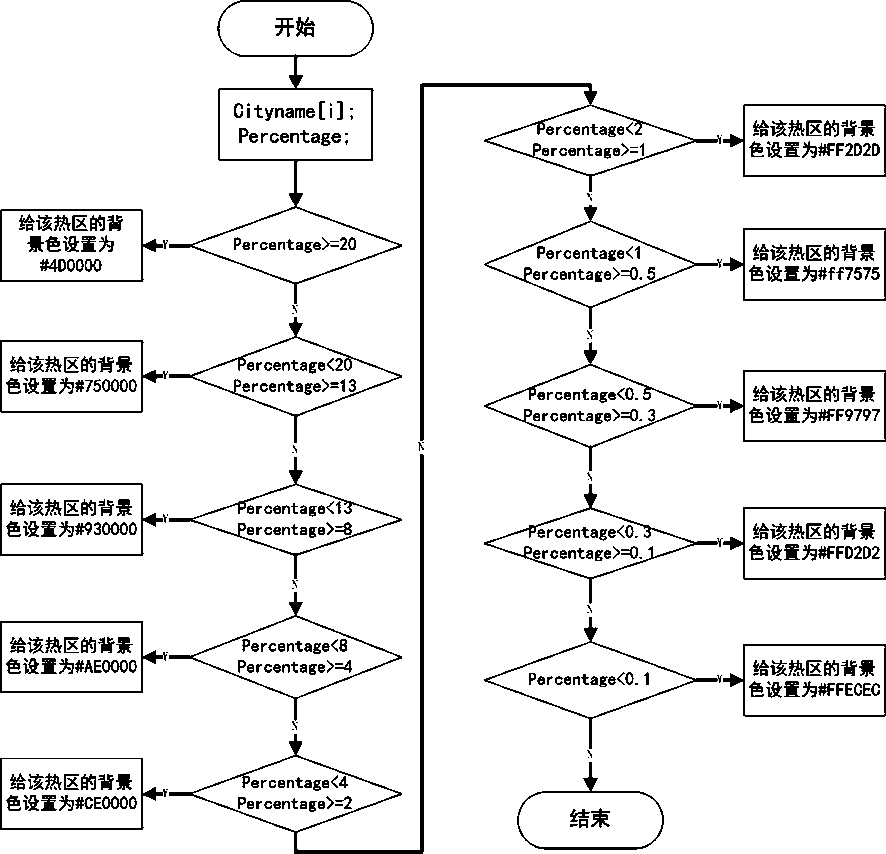
[0035] S4: Obtain the percentage of public opinion attention corresponding to an event in each place, color the corresponding area on the map according to the coloring algorithm, and finally display it on the map.

[0036] Preferably, said S1 specifically includ...


PUM


Abstract

The invention discloses a visual display method for an Internet public opinion map. The method comprises the steps that S1, a public opinion information database is constructed; S2, an XML database file is established according to the public opinion information database, and an XML file of public opinion geographic distribution of different events at different time is generated; S3, a flash file is utilized to call the specific XML database file; and S4, the percentage of a public opinion attention corresponding to a certain event at each place is acquired, coloring is performed on a corresponding region in the map according to a coloring algorithm, and finally display is performed on the map. Through the method, specific attention degrees of public opinions in the whole country and all provinces and municipalities can be observed precisely and visually; and on the other hand, the accuracy and instantaneity of public opinion prediction and early warning can be improved, and corresponding guidance thinking is provided for selection of a control strategy.

Description

technical field [0001] The present invention relates to the technical field of Internet public opinion information display, in particular to a method for visually displaying Internet public opinion maps. Background technique [0002] With the rapid development of the Internet, network media, as a new form of information dissemination, has penetrated into people's daily life. Netizens’ active speech on hot spots and hot events has reached an unprecedented level. Whether it is a major domestic or international event, online public opinion can be formed immediately. Through this kind of network, opinions and ideas can be spread, which in turn generates huge public opinion pressure, reaching any level. No department or institution can ignore it. It can be said that the Internet has become a distribution center for ideological and cultural information and an amplifier of public opinion. [0003] Internet public opinion is the highly influential and tendentious speeches and opin...

Claims


Application Information

Patent Timeline
Patent Type & Authority Applications(China)
IPC IPC(8): G06F17/30
CPCG06F16/83G06F16/951
Inventor 罗松龚凯黄宇康立
Owner SOUTHWESTERN UNIV OF FINANCE & ECONOMICS
Why Eureka
Try Eureka