

Heat map visualization method through reverse rendering
A technology of heat map and influence, applied in the field of data visualization, can solve the problems that the impact factor algorithm is not sensitive enough to detect data features, the data features are very different, deformation and distortion, etc., and achieve good data visualization effect and stable data feature effect
Inactive Publication Date: 2018-04-27
BEIJING UNIV OF CIVIL ENG & ARCHITECTURE
View PDF2 Cites 16 Cited by
- Summary
- Abstract
- Description
- Claims
- Application Information
AI Technical Summary
Problems solved by technology
However, some deficiencies have also been exposed, mainly as follows: (1) Poor self-adaptive ability, deformation and distortion at different scales, and the data characteristics displayed by the heat map are very different under different map scales; (2) POI The superposition mode of point influence is single, and the superposition mode only depends on the superposition rules of the renderer, which makes the impact factor algorithm not sensitive enough to detect data features; (3) The color gradient for generating the heat map is constructed empirically, and different heat maps need to be tried many times (4) The geospatial characteristics of the data are not fully considered when the heat map is drawn because the data is projected to the screen window
Method used
View moreImage
Smart ImageViewing Examples

Examples
Embodiment 1
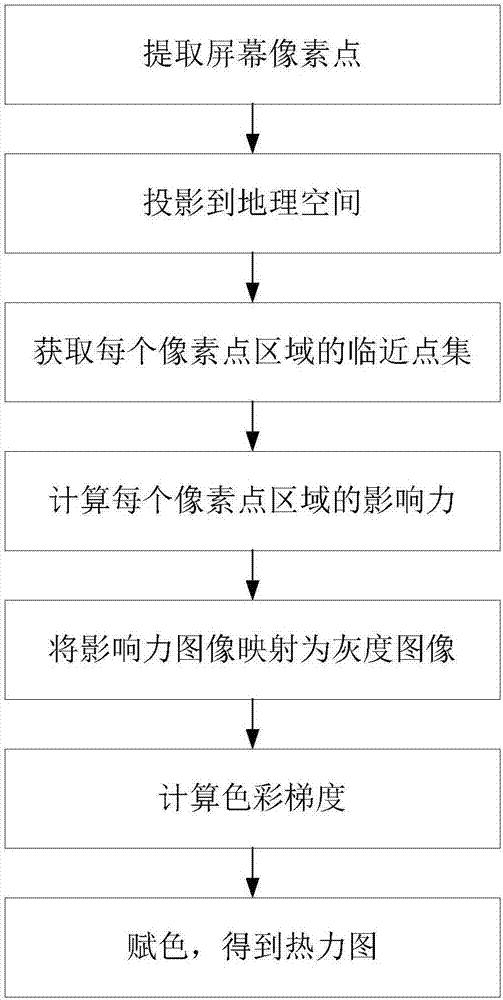
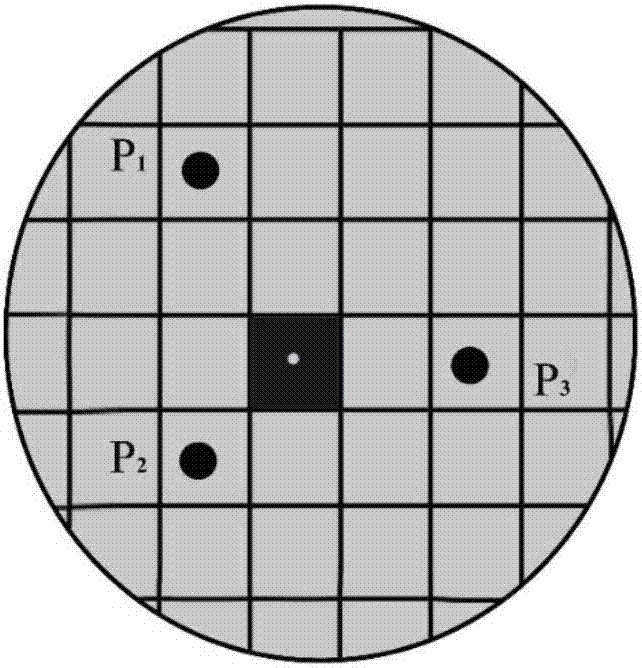
[0082] Import the previously obtained site registration data into the system, obtain the current Canvas canvas pixels through the window where the system is located, traverse the site registration data, calculate the adjacent range around the pixel through the haversine formula, and analyze the adjacent points of each pixel , calculate the influence of each pixel, draw the influence grayscale map, and then automatically analyze the distribution law of the grayscale map through the minimum entropy algorithm to obtain the gradient segmentation threshold of the heat map, and finally color the grayscale map through the obtained gradient color , to get the final heat map.
Login to View More PUM
 Abstract
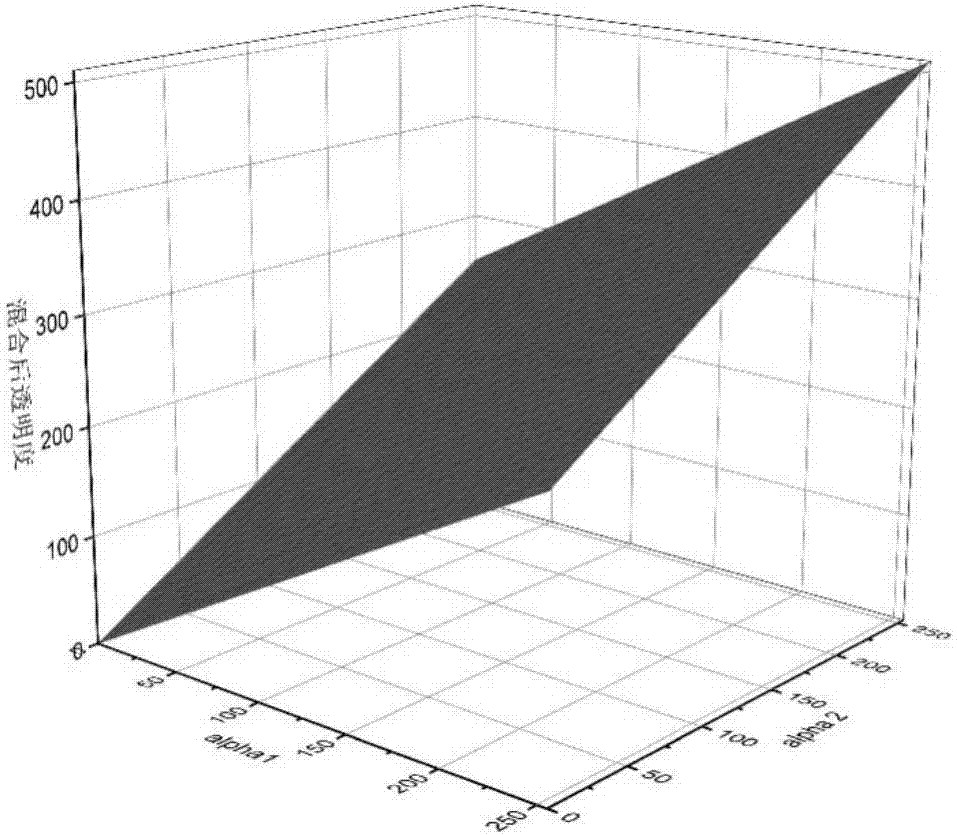
The invention discloses a heat map visualization method through reverse rendering. With a single pixel point of a window as an analysis point, the distribution of adjacent data points of the single pixel point is analyzed according to an influence power superposition mode suitable for current analysis, and an influence power image is calculated and mapped to a gray level image; according to the whole distribution law of the gray level image, a graded color grading threshold is divided and obtained, the color gradient of the heat map is acquired in the adaptive mode, and the heat map is obtained through coloring. The actual geographical and spatial distribution condition of the data is thoroughly considered, influences from the map scale are little, the data features can be expressed more stably, and the data visualization effects are good. First calculation and then rendering are carried out according to the screen pixel point, influence power superposition does not depend on a renderer, different influence power superposition models can be set according to different requirements, and the method is more suitable for geographical and spatial POI analysis.
Description
technical field [0001] The invention relates to a data visualization method, in particular to a heat map visualization method for reverse rendering. Background technique [0002] With the vigorous development of big data, data visualization technology is also developing rapidly. Due to the large amount of geospatial information bundled in big data, heat maps, as an intuitive visualization method, have good characteristics of comprehensively displaying data geospatial characteristics and attribute characteristics, and can help researchers in various fields acquire geospatial knowledge [1] , so it is very popular. Zhao Ting and others used the HeatMap released internally by Microsoft and combined with the k-means clustering algorithm to conduct research on the visual expression of geographic label data [2] ; Yang Wei used the heat map drawn after the improvement of the influence superposition algorithm to analyze the prices of residential areas across the country [3] Wu Zhi...
Claims
Login to View More Application Information
Patent Timeline
 Patent Type & AuthorityApplications(China)
IPC IPC(8): G06T11/00G06T11/20G06F17/30
CPCG06F16/29G06T11/001G06T11/206
Inventor徐志洁张健钦王胜开王硕
OwnerBEIJING UNIV OF CIVIL ENG & ARCHITECTURE