Heat map visualization method for reverse rendering
A heat map and influence technology, applied in the field of data visualization, can solve the problems that the data features are very different, the influence factor algorithm is not sensitive enough to the detection of data features, and the overlay mode only depends on the overlay rules of the renderer. The effect of stable data features and good data visualization
- Summary
- Abstract
- Description
- Claims
- Application Information
AI Technical Summary
Problems solved by technology
Method used
Image
Examples
Embodiment 1
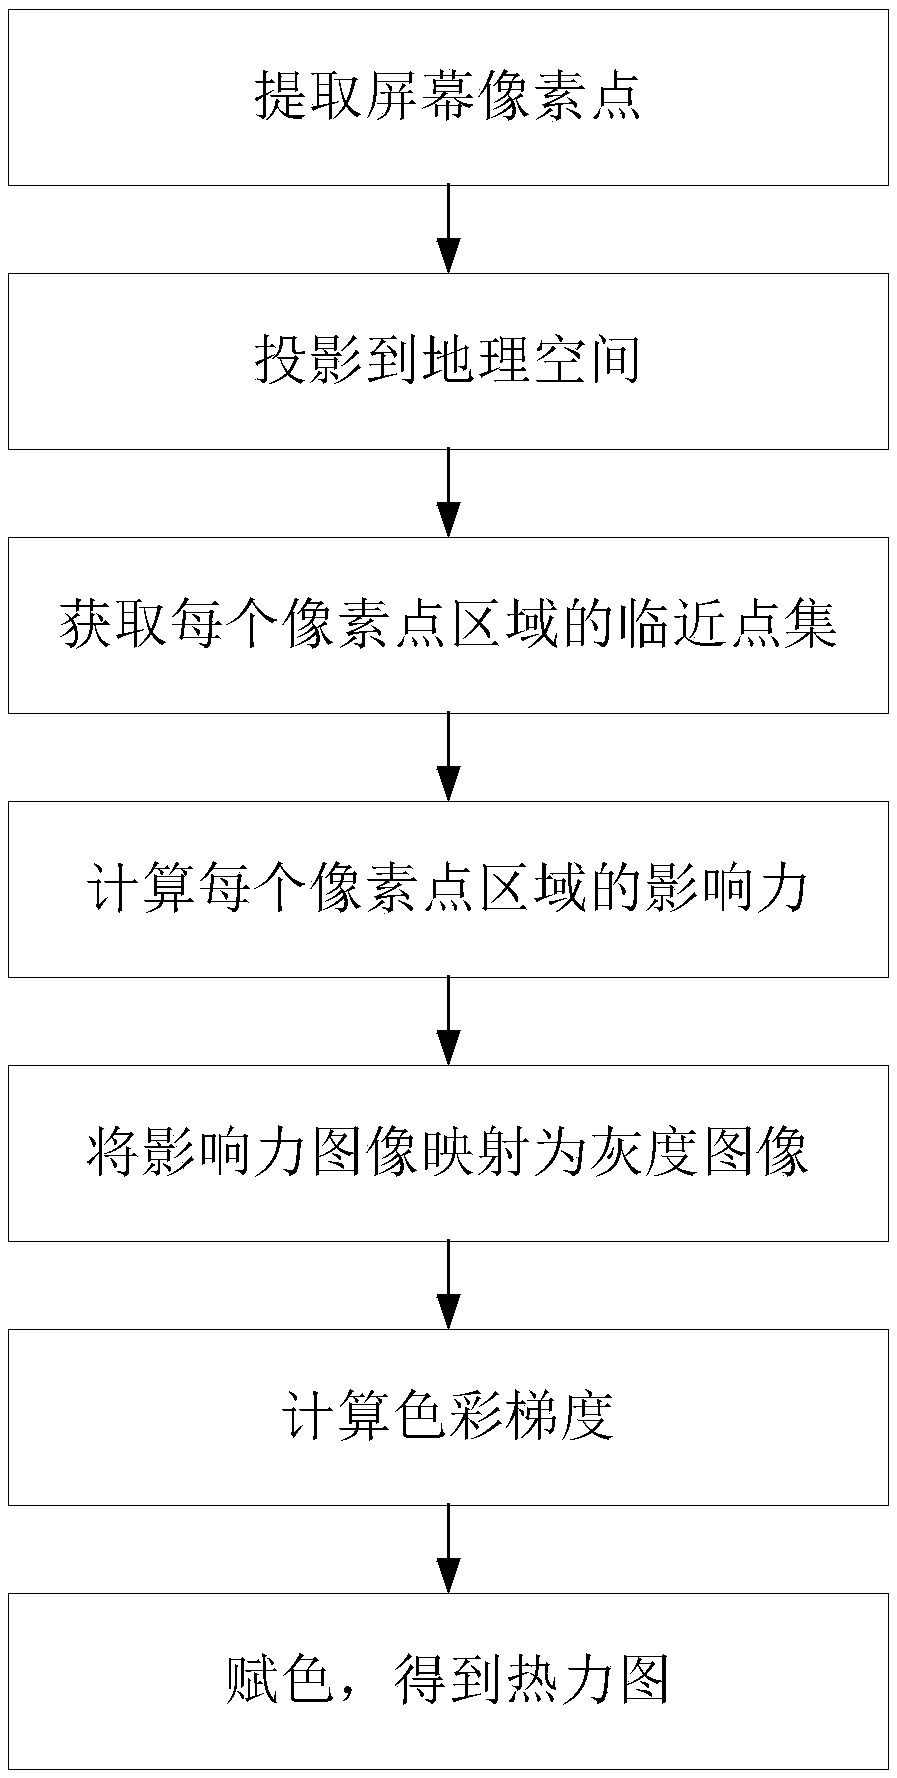
[0082] Import the previously obtained site registration data into the system, obtain the current Canvas canvas pixels through the window where the system is located, traverse the site registration data, calculate the adjacent range around the pixel through the haversine formula, and analyze the adjacent points of each pixel , calculate the influence of each pixel, draw the influence grayscale map, and then automatically analyze the distribution law of the grayscale map through the minimum entropy algorithm to obtain the gradient segmentation threshold of the heat map, and finally color the grayscale map through the obtained gradient color , to get the final heat map.
PUM
 Abstract
Description
Claims
Application Information
 - R&D
- Intellectual Property
- Life Sciences
- Materials
- Tech Scout
- Unparalleled Data Quality
- Higher Quality Content
- 60% Fewer Hallucinations
Browse by: Latest US Patents, China's latest patents, Technical Efficacy Thesaurus, Application Domain, Technology Topic, Popular Technical Reports.
© 2025 PatSnap. All rights reserved.Legal|Privacy policy|Modern Slavery Act Transparency Statement|Sitemap|About US| Contact US: help@patsnap.com


