A 3D data visualization method based on pca-radviz

A three-dimensional data and data technology, applied in the direction of visual data mining, structured data browsing, structured data retrieval, etc., can solve problems such as weakening, failure to achieve optimal, weakening visualization effects, etc., to achieve accurate decision-making and good data visualization effect of effect

Inactive Publication Date: 2021-01-08
NORTHEASTERN UNIV LIAONING
View PDF4 Cites 0 Cited by
  • Summary
  • Abstract
  • Description
  • Claims
  • Application Information

AI Technical Summary

Problems solved by technology

This algorithm has the advantages of low computational complexity and strong visualization effect, but it has certain limitations: 1. It will weaken or even eliminate some clustering information between data in the original n-dimensional space; 2. The nonlinear mapping of the algorithm leads to the final The result of the mapping is a many-to-one relationship
These two limitations weaken the final visualization effect of the algorithm to a certain extent, making it impossible to achieve the optimal

Method used


Image

  • A 3D data visualization method based on pca-radviz
  • A 3D data visualization method based on pca-radviz
  • A 3D data visualization method based on pca-radviz

Examples


Embodiment Construction

[0034] In order to make the purpose, design ideas and advantages of the present invention clearer, the present invention will be further described in detail below in combination with specific examples and with reference to the accompanying drawings.

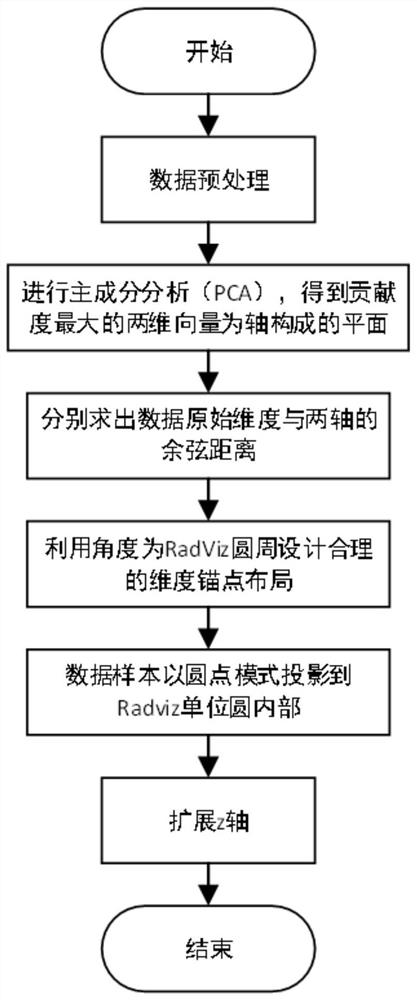
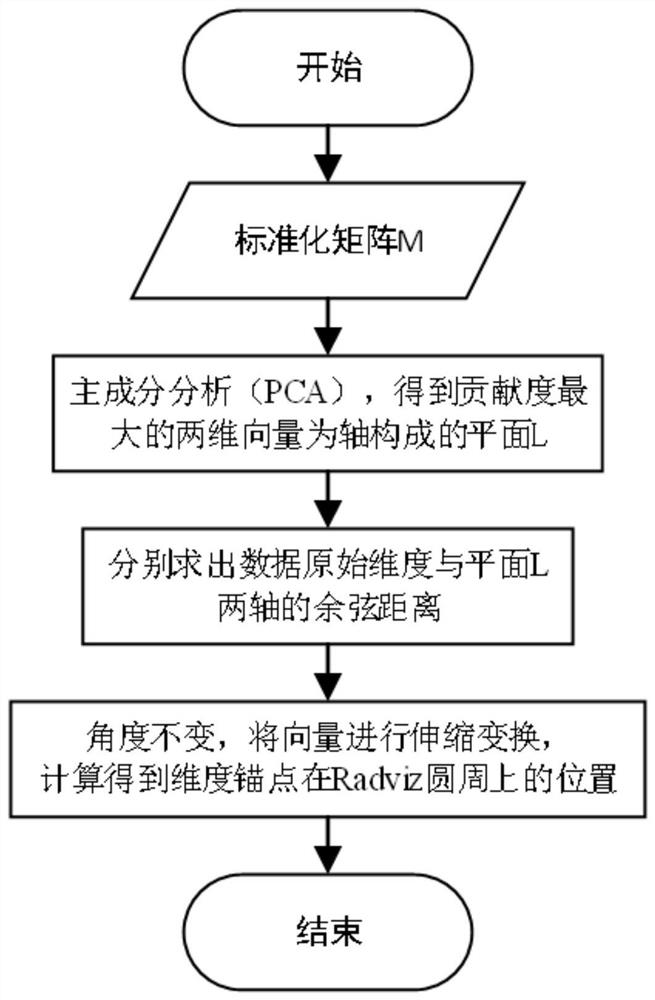
[0035] The invention provides a PCA-Radviz-based three-dimensional data visualization method, such as figure 1 As shown, it includes six main steps: 1) Standardize the original data, the original data uses Wine data to obtain the standardized matrix M; 2) Perform principal component analysis (PCA) on the standardized matrix M to obtain the The two-dimensional vector is a plane formed by the x and y axes; 3) calculate the cosine distances between the original dimension of the data and the x and y axes respectively, and obtain the angle and vector length of the original dimension projected on the plane; 4) use step 3) The obtained angles design a reasonable dimensional anchor point layout for the Radviz circle; 5) Project the data ...


PUM


Abstract

The invention provides a three-dimensional data visualization method based on PCA-Radviz, the steps of which are: 1) standardize the original data; 2) perform principal component analysis (PCA) on the processed data to obtain the maximum contribution The two-dimensional vector is the plane formed by the x and y axes; 3) calculate the cosine distance between the original dimension of the data and the x and y axes respectively, and obtain the angle and vector length of the original dimension projected on the plane; 4) use the The obtained angles design a reasonable dimensional anchor point layout for the Radviz circle; 5) Project the data samples into the Radviz unit circle in a dot mode; 6) Extend the z-axis to pull the two-dimensional plane points into the three-dimensional volume. Based on PCA‑Radviz, the present invention displays the data of different types of data samples, which not only provides users with as much data clustering information as possible, but also achieves a better data visualization effect, so that users can perform faster, intuitive, and accurate decision.

Description

technical field [0001] The invention belongs to the technical field of computer information processing, and relates to a three-dimensional data visualization method based on PCA-Radviz. Background technique [0002] With the advent of the era of big data, data mining has become a popular research direction of data analysis. The analysis methods it contains are fully automated, efficient and economical, but due to the lack of a correction process of human-computer interaction, their accuracy is usually lower than the results of manual analysis. Data visualization makes up for this shortcoming and improves human cognitive ability. Radviz (Radial Coordinate Visualization) is a visualization algorithm based on the spring model. It provides a special way of thinking to observe the relationship between data, and can study high-dimensional data from a global perspective. [0003] The main idea of ​​the classic Radviz algorithm is to use a nonlinear method to map points with high...

Claims


Application Information

Patent Timeline
Patent Type & Authority Patents(China)
IPC IPC(8): G06F16/26G06K9/62
CPCG06F16/26G06F18/2135
Inventor 殷晶晶
Owner NORTHEASTERN UNIV LIAONING
Why Eureka
Try Eureka