Visual analysis method for comparing community division of public bicycle stations

A bike-sharing, community-division technology

Active Publication Date: 2018-07-13
HANGZHOU DIANZI UNIV
View PDF7 Cites 18 Cited by
  • Summary
  • Abstract
  • Description
  • Claims
  • Application Information

AI Technical Summary

Problems solved by technology

[0004] Existing research only uses a specific method to divide the bicycle network into communities, and cannot analyze why a certain station is divided into a certain community, nor can it compare the similarities and differences between the division results of different methods

Method used


Image

  • Visual analysis method for comparing community division of public bicycle stations
  • Visual analysis method for comparing community division of public bicycle stations
  • Visual analysis method for comparing community division of public bicycle stations

Examples


Embodiment

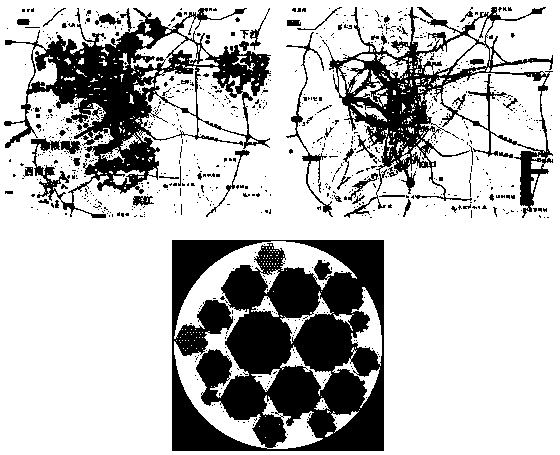
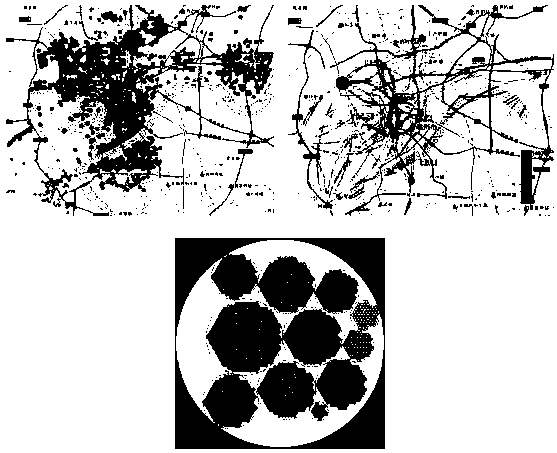
[0083] Figure 2 shows the comparison of the results of the community division of public bicycle stations in Hangzhou. For the results obtained by each algorithm, the three graphs from left to right are the cluster scatter plot, the cluster association plot, and the community partition comparison plot. Figure 2a , 2b , 2c are the results of using infomap, combo and louvain algorithms respectively. From the cluster scatter plot, it is found that the adjacent stations are classified into the same community. From the cluster correlation diagram, it is found that the relationship between the communities is mostly not close, and the connection lines are light-colored, and only some communities are strongly connected, and the connection lines are dark or light-dark. Since the infomap algorithm is the first algorithm adopted, the site color in the community division comparison graph is based on the assignment result of the algorithm. From the comparison diagram of community divisi...


PUM


Abstract

The invention discloses a visual analysis method for comparing community division of public bicycle stations. The method includes: displaying geographical distribution of the stations after communitydivision and borrowing and returning association among regions by designing multiple visual views, and supporting visual comparison of commonalities and differences of results of different community division algorithms; in order to display the geographical distribution of the stations after division more clearly, putting forward a color assignment strategy and keeping the stations located at the similar geographical regions identical in color as much as possible for community division results acquired different algorithms; designing a community division comparison view based on circular inclusion, which helps to compare which communities the stations are divided into in different ways. With the method, result difference of the different community division algorithms on public bicycle network can be displayed visually, internal division mechanism of the algorithms is understood beneficially, traffic management personnel are helped to understand operation of the public bicycle system, and assistant decision-making is provided for bicycle scheduling and system management.

Description

technical field [0001] The invention belongs to the technical field of traffic information, in particular to a visual analysis method for comparing the community division of public bicycle stations. Background technique [0002] The urban public bicycle system provides a shared bicycle rental service, which has the advantages of no pollution and environmental friendliness, and can effectively solve the "last mile" problem and relieve traffic pressure. Users can borrow and return bikes at any bike station in the city. The user borrowing and returning car data recorded by the system contains a wealth of time and space information. [0003] In order to discover the operating rules of the system, the public bicycle system can be regarded as a network, the stations are the nodes in the network, and the borrowing and repaying amount of users between stations is the network edge. The existing methods use community discovery algorithm to divide the bicycle network, divide the clos...

Claims


Application Information

Patent Timeline
Patent Type & Authority Applications(China)
IPC IPC(8): G06Q10/04G06Q50/30G08G1/01
CPCG06Q10/04G06Q50/30G08G1/0137
Inventor 史晓颖王洋杨晓航林菲徐海涛
Owner HANGZHOU DIANZI UNIV
Why Eureka
Try Eureka