
SVG-based graph data showing system

A technology of charts and data, applied in the computer field, can solve problems such as high data density, not supporting event handlers, editing, etc., and achieve a strong interactive effect

Active Publication Date: 2018-11-13
DAWNING INFORMATION IND BEIJING +1
View PDF8 Cites 1 Cited by
  • Summary
  • Abstract
  • Description
  • Claims
  • Application Information

AI Technical Summary

Problems solved by technology

Currently commonly used data display methods, such as echarts based on canvas, are not enough to cope with the multiple reuse of massive data. The large data level makes the data display very cumbersome, and the massive data cannot be flexibly operated. The high density of data leads to data The details shown are invalid
The specific defect is that the generated chart cannot be modified, edited, zoomed without distortion, chart dragged and other operations; the generated chart is not dynamic and interactive, and it needs to be redrawn once the data changes or the position changes
The above defects exist because the bottom layer of echarts is based on canvas, and canvas technology is based on bitmap images, which are rendered pixel by pixel. 2D graphics are drawn through JavaScript, which depends on resolution, does not support event handlers, and has weak text rendering capabilities.

Method used


Image

  • SVG-based graph data showing system
  • SVG-based graph data showing system
  • SVG-based graph data showing system

Examples


Embodiment Construction

[0011] In order to make the purpose, technical solutions and advantages of the embodiments of the present invention clearer, the technical solutions in the embodiments of the present invention will be clearly and completely described below in conjunction with the drawings in the embodiments of the present invention. Obviously, the described embodiments It is only some embodiments of the present invention, but not all embodiments. Based on the embodiments of the present invention, all other embodiments obtained by persons of ordinary skill in the art without making creative efforts belong to the protection scope of the present invention.

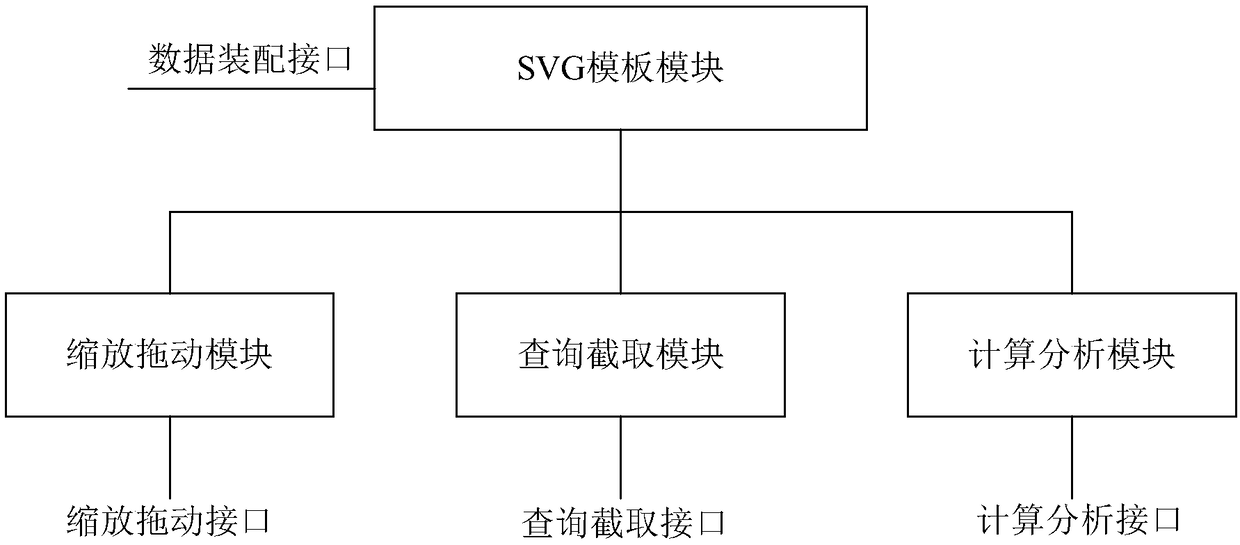
[0012] The present invention provides a graph data display system based on SVG, such as figure 1 As shown, the system includes an SVG template module, a scaling and dragging module, a query interception module and a calculation and analysis module.

[0013] Wherein, the SVG template module is used to convert the source data into a data group...


PUM


Abstract

The invention provides an SVG-based graph data showing system. The system comprises an SVG template module, a zooming dragging module, an inquiry capture module, and a calculation analysis module, wherein the SVG template module is used for converting source data into a data group with screen coordinates, loading the data group to an SVG-based XML template file, and generating a base SVG data graph, the zooming dragging module is used for zooming and dragging the SVG data graph by using JavaScript, the inquiry capture module is used for positioning, according to designated coordinates input bya user, a data point of the designated coordinates, capturing data automatically through captured coordinates input by the user and displaying a window adaptively, and the calculation analysis moduleis used for calculating and analyzing the source data according to user demands so as to generate a new graph. Through adoption of the system, graph data can be dragged and zoomed nondestructively, can be inquired and captured, and can be calculated and analyzed.

Description

technical field [0001] The invention relates to the field of computer technology, in particular to an SVG-based chart data display system. Background technique [0002] In engineering projects, there are often scenarios where massive amounts of data are displayed. With the increase of business volume, the volume of data is getting bigger and bigger, the data density is getting bigger and bigger, and the cost of data processing is getting bigger and bigger. The demand for multiple data utilization in one request is becoming more and more prominent. Currently commonly used data display methods, such as echarts based on canvas, are not enough to cope with the multiple reuse of massive data. The large data level makes the data display very cumbersome, and the massive data cannot be flexibly operated. The high density of data leads to data The details shown are invalid. The specific defect is that the generated chart cannot be modified, edited, zoomed without distortion, chart ...

Claims


Application Information

Patent Timeline
Patent Type & Authority Applications(China)
IPC IPC(8): G06F3/0484G06F17/30
CPCG06F3/0484G06F3/04842G06F3/04845
Inventor 管浩
Owner DAWNING INFORMATION IND BEIJING
Learn More