Data balancing method based on pseudo-negative samples and method for improving data classification performance
A data balance and negative sample technology, applied in the field of information processing, can solve problems such as imbalanced data learning, loss of classification information, and low data classification accuracy.
- Summary
- Abstract
- Description
- Claims
- Application Information
AI Technical Summary
Problems solved by technology
Method used
Image
Examples
Embodiment 1
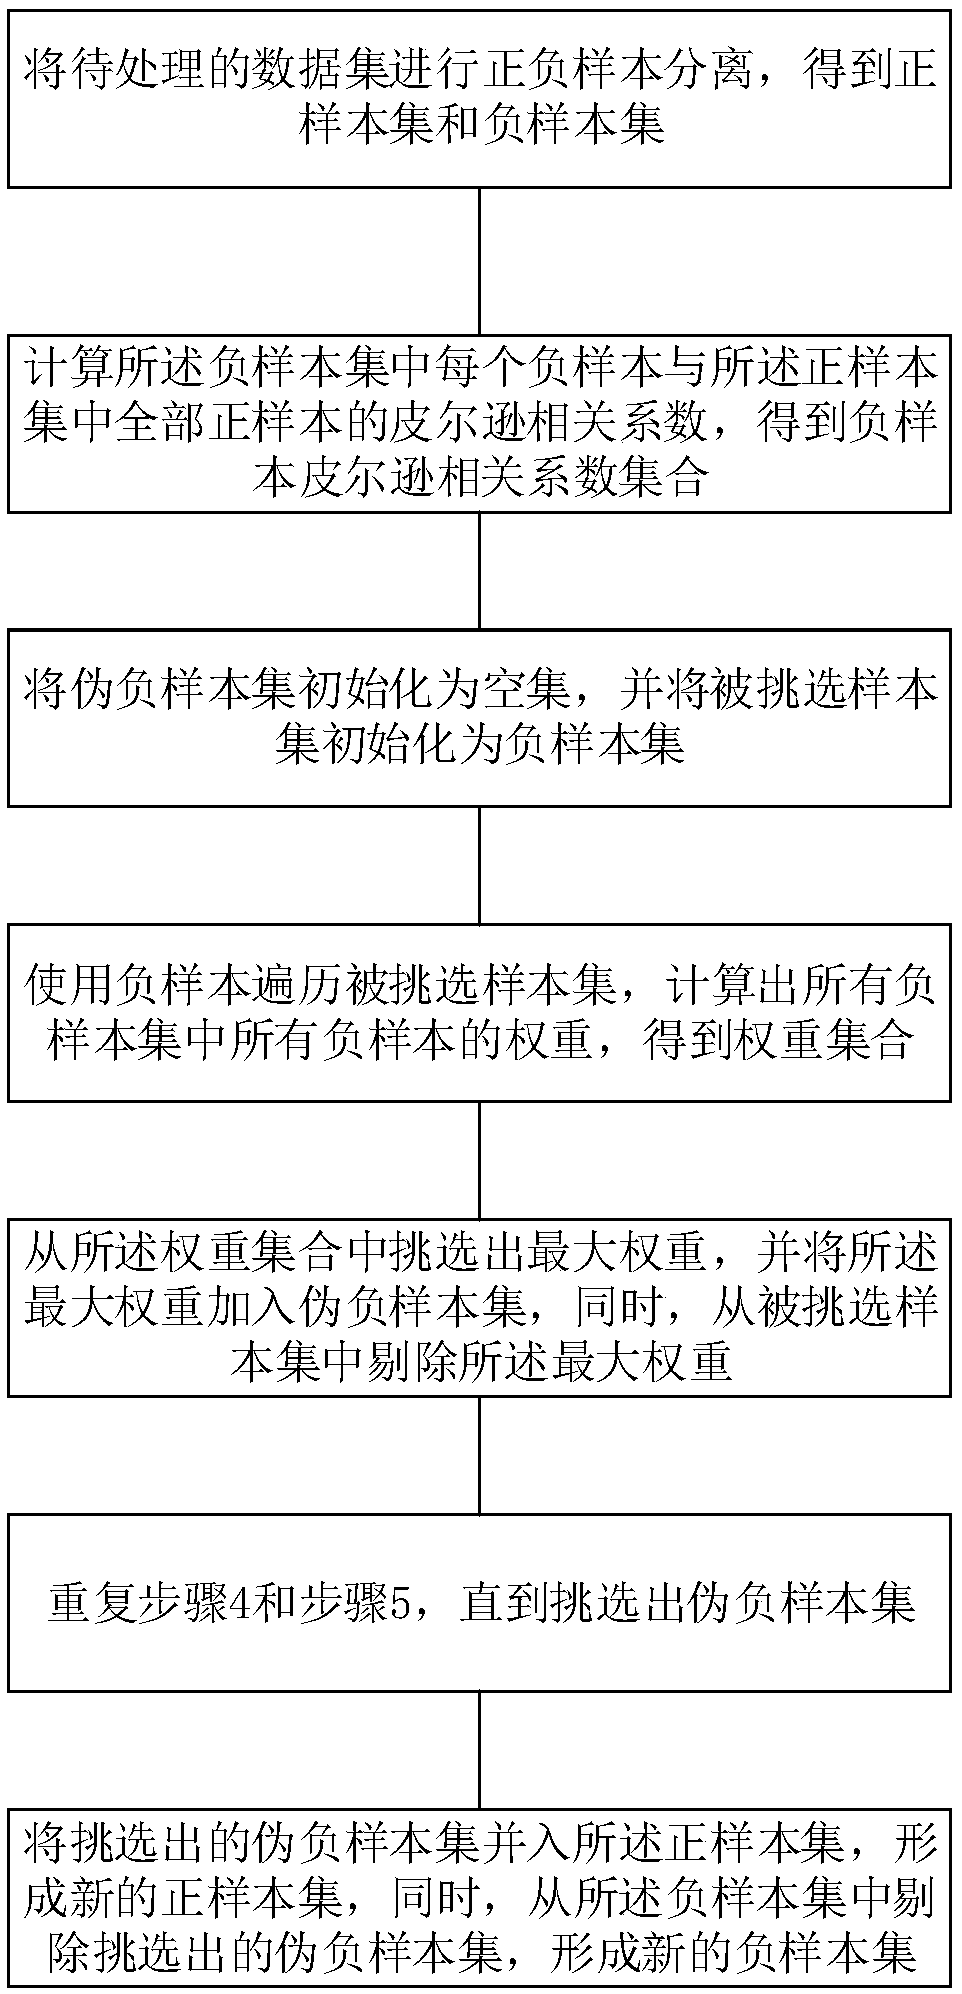
[0107] In this embodiment, using the data balancing method of the present invention, pseudo-negative samples are selected on the CMC and Haberman data sets according to different pseudo-negative sample rates (that is, the proportion of the number of pseudo-negative samples to the number of positive samples), and four kinds of The classifier performs data classification and classification performance evaluation.
[0108] Set the false negative sample rate from 0% to 50%, 0% means no false negative samples are picked. The selection results on CMC are shown in Table 2. It can be seen that the larger the percentage of pseudo-negative samples, the better the performance. When the proportion of pseudo-negative samples is 0%, 10%, 20%, 30%, 40% and 50%, the Sen of random forest is 28.19%. , 39.22%, 43.94%, 50.87%, 56.45% and 62%, the Acc values were 78.2%, 78.75%, 78.41%, 78.48%, 79.57% and 79.63%, and the MCC values were 0.27, 0.369, 0.404, 0.448, 0.505 and 0.532. The perform...
Embodiment 2
[0116] This example verifies the effectiveness of the method of the present invention on real biological data. The dataset includes PDNA-316, PDNA-543, SNP.
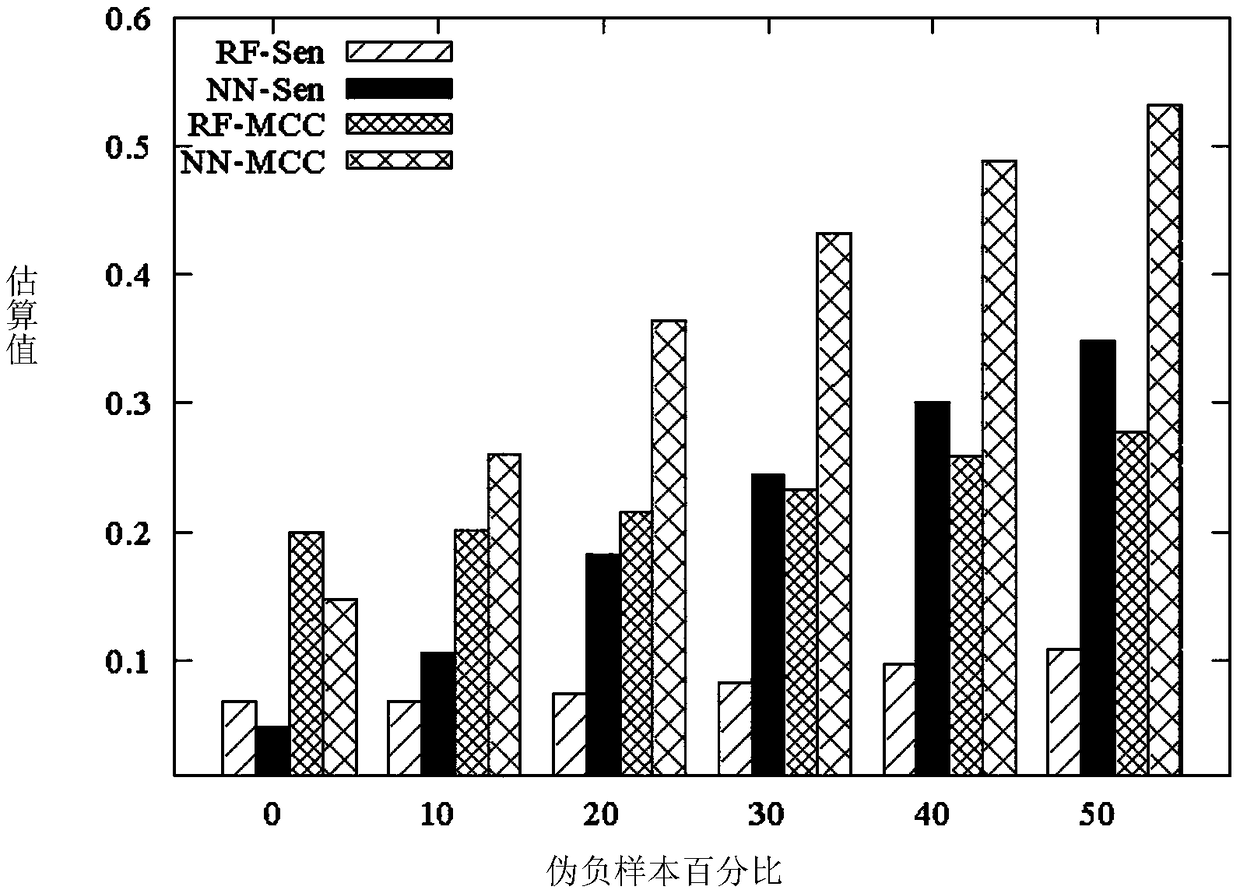
[0117] figure 2 The classification performance of the PDNA-543 dataset under different pseudo-negative sample rates is shown, where RF-Sen and NN-Sen represent the Sen (sensitivity value) of the RF (neural network) and NN (discriminant analysis) classifiers, and RF-Sen MCC and NN-MCC represent the MCC values of RF and NN classifiers, respectively. It can be seen that the Sen and MCC metrics of the neural network increase as the percentage of false negative samples increases from 0% to 50%, while the Sen and MCC of the random forest remain the same when the percentage of false negative samples varies from 0% to 30%. , and when the percentage of false negative samples exceeds 30%, as the percentage increases, RF has better performance.
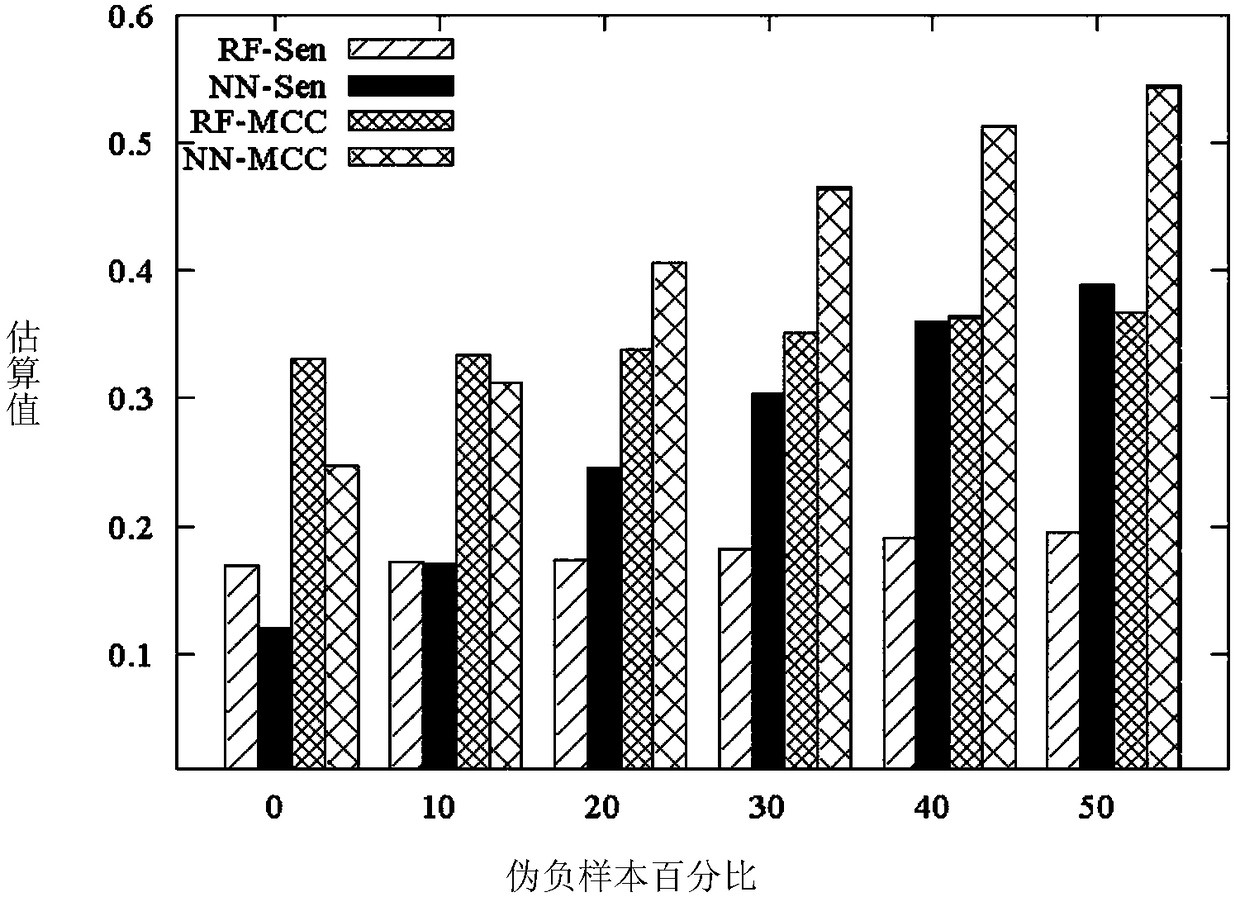
[0118] image 3 Classification performance on the PDNA-316 dataset at different...
Embodiment 3
[0121] The MMPCC algorithm and the MAXR algorithm were compared with the MINR algorithm using PDNA-316 data. Wherein MMPCC is the abbreviation of the algorithm of the present invention.
[0122] In Example 3, five-fold cross-validation is still used to evaluate the prediction performance of the proposed algorithm on these four indicators. Using the PDNA-316 data set to compare the classification performance of the MMPCC algorithm, the MAXR (max-relevance) algorithm and the MINR (min-redundancy) algorithm, the comparison results are as follows Figure 5-8 shown.
[0123] according to Figure 5-8 , we can easily find that in RF and NN classifiers, MMPCC is superior to MAXR and MINR methods in both RF classifiers and NN classifiers. from Figure 5 It can be seen that the pseudo-negative samples have a greater impact on the Sen value. When NN is used as a classifier, the Sen value of MMPCC is significantly better than MAXR and MINR. For RF classifiers, MAXR is the best when m...
PUM
 Abstract
Description
Claims
Application Information
 - R&D
- Intellectual Property
- Life Sciences
- Materials
- Tech Scout
- Unparalleled Data Quality
- Higher Quality Content
- 60% Fewer Hallucinations
Browse by: Latest US Patents, China's latest patents, Technical Efficacy Thesaurus, Application Domain, Technology Topic, Popular Technical Reports.
© 2025 PatSnap. All rights reserved.Legal|Privacy policy|Modern Slavery Act Transparency Statement|Sitemap|About US| Contact US: help@patsnap.com


