Method for measuring thickness and maximum flow velocity of overtopping water body
A technology of maximum flow velocity and water body, which is applied in the direction of measuring device, fluid dynamics test, machine/structural component test, etc., can solve the problems such as difficult to effectively measure the thickness of water body over waves, maximum flow velocity, short action time, etc., and achieve the goal of laying Convenient and efficient effect
- Summary
- Abstract
- Description
- Claims
- Application Information
AI Technical Summary
Problems solved by technology
Method used
Image

Examples
Embodiment 1
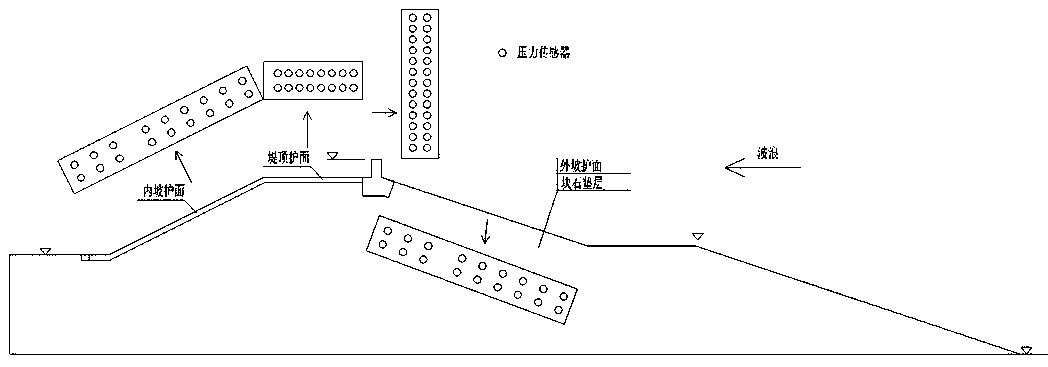
[0026] Embodiment 1: refer to Figure 1 to Figure 3 , a method for measuring the maximum flow velocity of a surfing water body, which includes,
[0027] Modular sensors are used to obtain pressure data, and fluid parameters such as water density and impact coefficient are input as required. After the calculation of the above fluid parameters, the flow velocity value can be accurately obtained, and the maximum flow velocity can be obtained.
[0028] The calculation formula of the above operation is:
[0029]
[0030] Among them, in the formula: p is pressure, u is flow velocity, ρ is water density, C w is the impact coefficient.
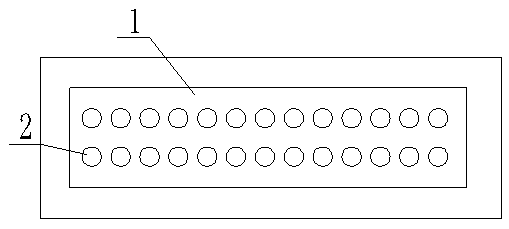
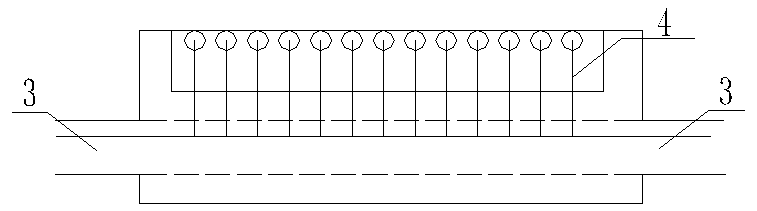
[0031] The above-mentioned modular pressure sensor is located above the breakwater wall and is perpendicular to the breakwater wall. The above-mentioned modular pressure sensor includes a rigid or flexible plate, and a pressure sensor is provided on the front of the plate to obtain measurement data at different positions above the breakwater wal...
PUM
 Abstract
Description
Claims
Application Information
 - R&D
- Intellectual Property
- Life Sciences
- Materials
- Tech Scout
- Unparalleled Data Quality
- Higher Quality Content
- 60% Fewer Hallucinations
Browse by: Latest US Patents, China's latest patents, Technical Efficacy Thesaurus, Application Domain, Technology Topic, Popular Technical Reports.
© 2025 PatSnap. All rights reserved.Legal|Privacy policy|Modern Slavery Act Transparency Statement|Sitemap|About US| Contact US: help@patsnap.com