Method for realizing train passenger capacity analysis by using real-trace running chart

A technology of actual running diagram and passenger capacity, which is applied in the field of train passenger capacity analysis, can solve problems such as unsatisfactory page zoom effect, freeze, slow loading of charts, etc., and achieve the effect of self-adaptive layout

Active Publication Date: 2020-01-14
ZHEJIANG SUPCON INFORMATION TECH CO LTD
View PDF5 Cites 1 Cited by
  • Summary
  • Abstract
  • Description
  • Claims
  • Application Information

AI Technical Summary

Problems solved by technology

[0009] The purpose of the present invention is to overcome the disadvantages in the prior art that there are too many recording time points, the loading of the chart drawn by echarts is too slow, there will be a phenomenon of freezing, and the page zooming effect is not ideal, and it provides a method that uses real traces to run Diagram to realize the method of train passenger volume analysis

Method used


Image

  • Method for realizing train passenger capacity analysis by using real-trace running chart
  • Method for realizing train passenger capacity analysis by using real-trace running chart
  • Method for realizing train passenger capacity analysis by using real-trace running chart

Examples


Embodiment Construction

[0045] The present invention will be further described below in conjunction with the accompanying drawings and specific embodiments.

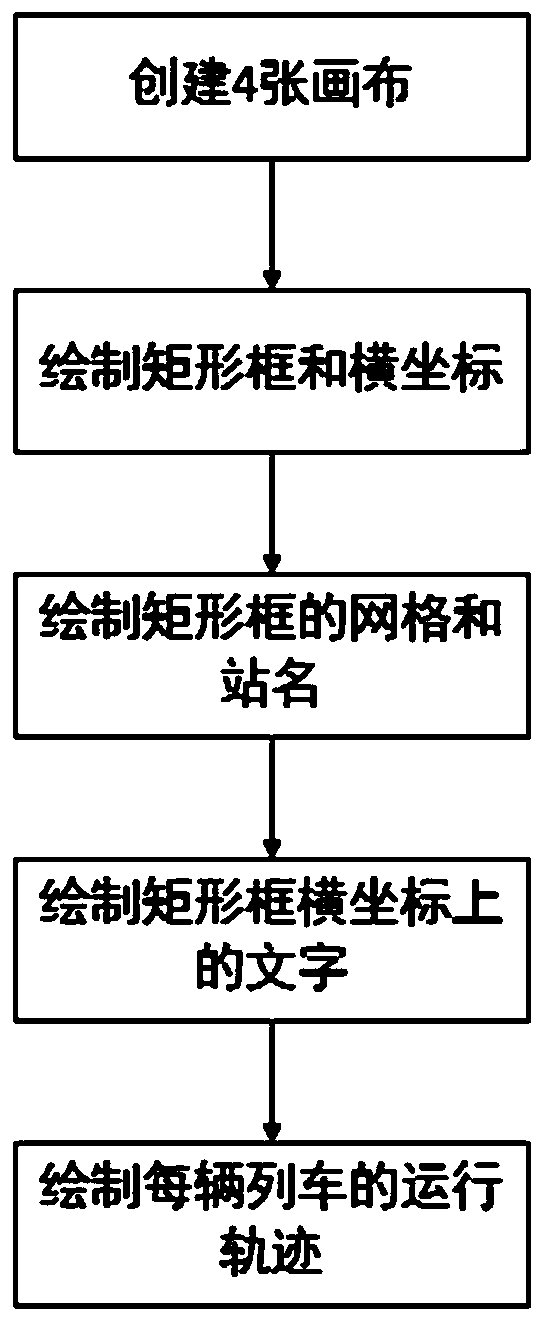
[0046] Such as figure 1 Shown embodiment is a kind of method that utilizes actual trace running diagram to realize train passenger capacity analysis, it is characterized in that, comprises the steps:

[0047] (1-1) In the web page, use the hypertext editing language HTML5 to create 4 canvases, and make the coordinates of the origins of the 4 canvases the same through the CSS absolute positioning of the cascading style sheet CSS;

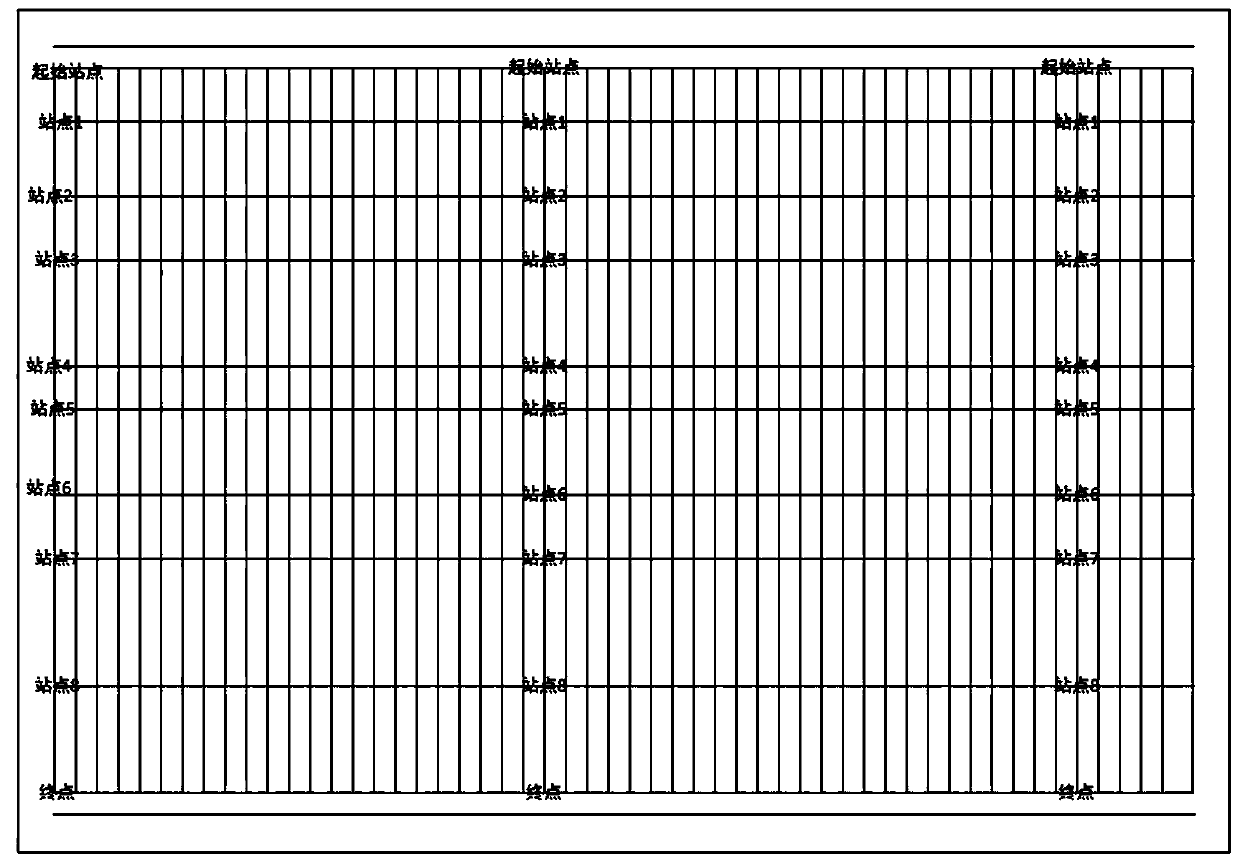
[0048] The origin is located in the upper left corner of the web page, the horizontal axis of each canvas represents time, and the vertical axis represents distance;

[0049] The first canvas is used to draw the rectangular frame and the two horizontal lines above and below the rectangular frame; the second canvas is used to draw the grid of the rectangular frame and the station name on the grid; the third canvas is ...


PUM


Abstract

The invention discloses a method for realizing train passenger capacity analysis by using a real-trace running chart, which comprises the following steps of: in a webpage, creating four canvas by using a hypertext editing language HTML5, and enabling origin positions of coordinates of the four canvas to be the same through CSS absolute positioning of a cascading style sheet CSS; drawing a rectangular frame on the first canvas by using Javascript codes, drawing the width and the height of the rectangular frame according to the same proportion of the width and the height of the canvas, respectively drawing two transverse lines above and below the rectangular frame, and enabling the lengths of the two transverse lines to be the same as the transverse extension length of the rectangular frame.The method has the advantages that a traditional train timetable is displayed to professionals more vividly, and tracks of different colors are described in the actual track running chart according to passenger flow volume so that workers can judge the energy consumption of each section of the train.

Description

technical field [0001] The invention relates to the technical field of man-machine interface display of rail transit and highway traffic monitoring products, in particular to a method for realizing train passenger capacity analysis by using a real-track running diagram. Background technique [0002] Canvas: Canvas is a new component of HTML5. It is like a curtain on which various charts, animations, etc. can be drawn with JavaScript. [0003] Javascript: It is a literal scripting language used on web pages to add logic functions to web pages. [0004] CSS: (Cascading Style Sheets) is an acronym for Cascading Style Sheets, which can not only statically modify web pages, but also dynamically format web page elements with various scripting languages. [0005] CSS Absolute Positioning: Absolute positioning is a property in CSS that places elements in the nearest positioned parent element and adjusts the distance from the parent element. [0006] In many traditional information...

Claims


Application Information

Patent Timeline
Patent Type & Authority Applications(China)
IPC IPC(8): G06F16/26G06F16/29G06F9/451G06F9/455G06Q50/26
CPCG06F16/26G06F16/29G06F9/451G06F9/45529G06Q50/26Y02D10/00
Inventor 臧亚星丁康曹辉姜雪明王雯
Owner ZHEJIANG SUPCON INFORMATION TECH CO LTD
Why Eureka
Try Eureka