
Visual analysis method for financial official account data

An analysis method and official account technology, applied in the field of visual analysis of financial official account data, can solve problems such as lack of visualization at the content analysis level

Active Publication Date: 2020-06-23
上海华鑫股份有限公司
View PDF4 Cites 0 Cited by
  • Summary
  • Abstract
  • Description
  • Claims
  • Application Information

AI Technical Summary

Problems solved by technology

[0002] The amount of information from self-media accounts for a relatively large proportion of the current media forms. For financial self-media, the prediction of stock prices is one of its main contents. Relevant institutions and personnel have high information needs. There is a correlation between the amount of attention, the amount of reading and the stock price. Currently, most of the visualization of official account content is based on the display of basic data, which is lacking in content analysis and interactive comparative visualization.

Method used


Image

  • Visual analysis method for financial official account data
  • Visual analysis method for financial official account data
  • Visual analysis method for financial official account data

Examples


Embodiment

[0015] Example: such as Figure 1-3 shown

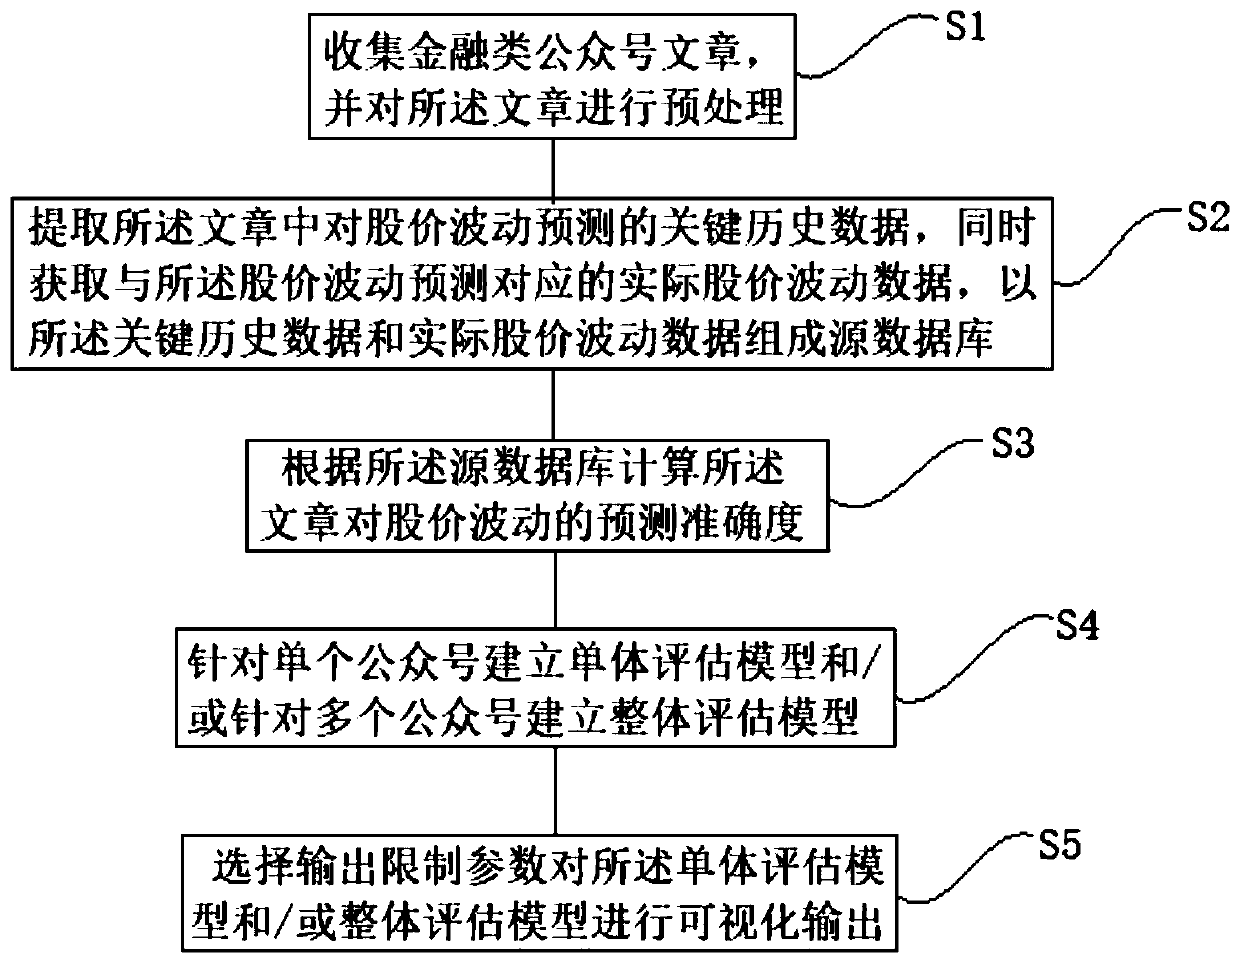
[0016] A method for visual analysis of financial official account data, comprising the following steps:

[0017] S1. Collect financial public account articles and preprocess the articles;

[0018] S2. Extract the key historical data of stock price fluctuation prediction in the article, and at the same time obtain the actual stock price fluctuation data corresponding to the stock price fluctuation prediction, and form the source database with key historical data and actual stock price fluctuation data;

[0019] S3. Calculate the prediction accuracy of the article on stock price fluctuations according to the source database;

[0020] S4. Establish a single evaluation model for a single official account and / or establish an overall evaluation model for multiple official accounts;

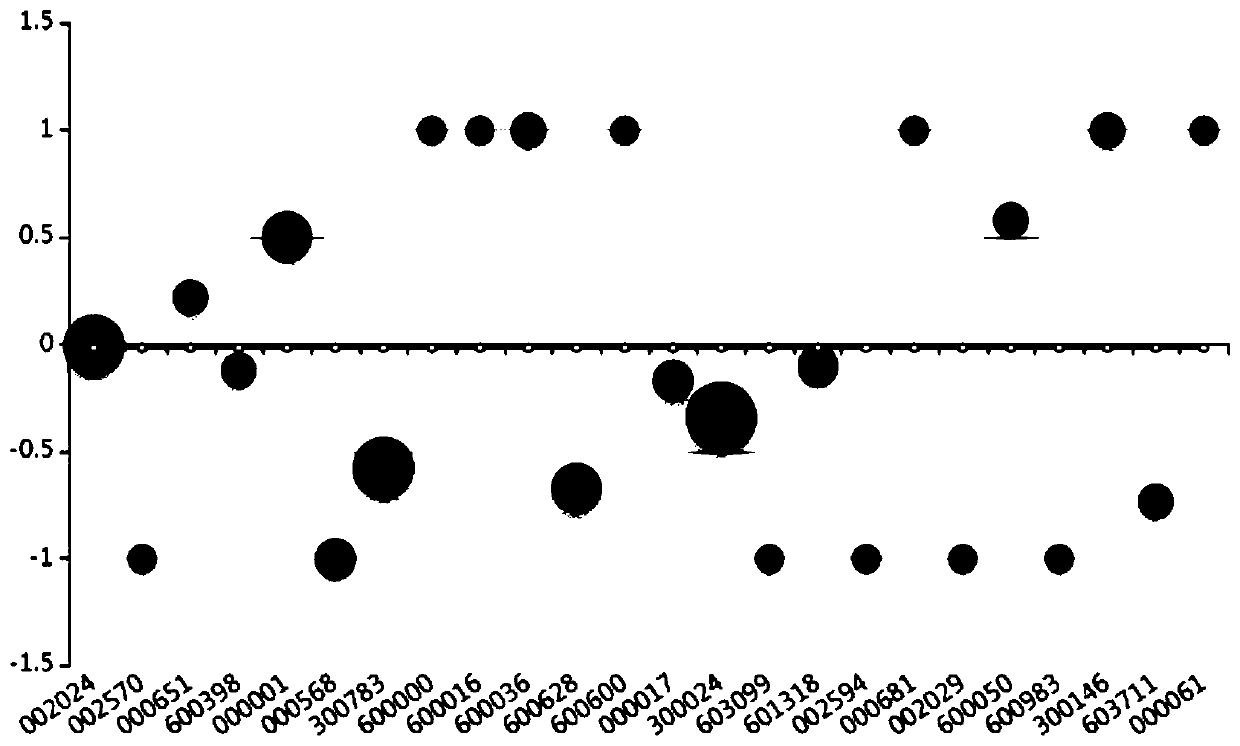
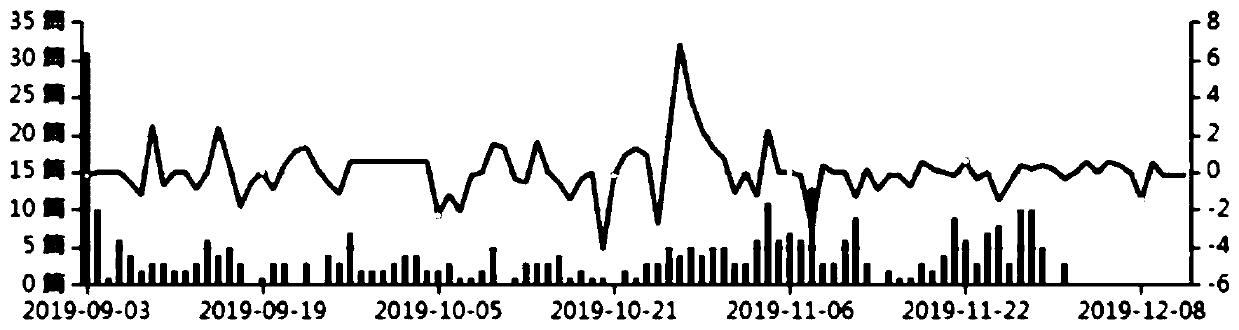
[0021] S5. Select the output restriction parameter to visually output the single evaluation model and / or the overall evaluation model.

[0022] A large nu...


PUM


Abstract

The invention relates to a visual analysis method for financial official account data, which comprises the following steps: S1, collecting financial official account articles, and preprocessing the articles; s2, extracting key historical data for stock price fluctuation prediction in the article, obtaining actual stock price fluctuation data corresponding to the stock price fluctuation prediction,and forming a source database by using the key historical data and the actual stock price fluctuation data; s3, calculating the prediction accuracy of the article for stock price fluctuation according to the source database; s4, establishing a single evaluation model for a single official account and / or establishing an overall evaluation model for a plurality of official accounts; and S5, selecting an output limiting parameter to carry out visual output on the single evaluation model and / or the overall evaluation model. Through arrangement and analysis of data in an official account article,the accuracy of official account prediction can be visually judged, an appropriate official account is selected for concerned reading, and a visual interactive comparison analysis result is obtained through selection of output limiting parameters.

Description

technical field [0001] The invention relates to the field of financial information visualization, in particular to a method for visual analysis of financial official account data. Background technique [0002] The amount of information from self-media accounts for a relatively large proportion of the current media forms. For financial self-media, the prediction of stock prices is one of its main contents. Relevant institutions and personnel have high information needs. There is a correlation between the amount of attention, the amount of reading, and the stock price. Currently, the visualization of official account content is mostly based on the display of basic data, and lacks content analysis and interactive comparative visualization. Contents of the invention [0003] In order to solve the above problems, a visual analysis method for financial official account data is provided, including the following steps: [0004] S1. Collect financial public account articles, and p...

Claims


Application Information

Patent Timeline
Patent Type & Authority Applications(China)
IPC IPC(8): G06F16/34G06F16/335G06Q40/04
CPCG06F16/34G06F16/337G06Q40/04
Inventor 李少华王习平胡彦鹏王长波崔雅隽李晨辉沙曼
Owner 上海华鑫股份有限公司
Learn More