A data analysis method based on user information

A user information and data analysis technology, applied in network data management, wireless communication, instruments, etc., can solve the problems of inaccurate data analysis, loss of important variables, low model contribution, etc., and achieve the effect of improving accuracy

Active Publication Date: 2020-11-10
索信达(北京)数据技术有限公司 +1
View PDF7 Cites 0 Cited by
  • Summary
  • Abstract
  • Description
  • Claims
  • Application Information

AI Technical Summary

Problems solved by technology

Although the variables are selected, the above method may have two disadvantages: the selected variables may not contribute a lot to the model; in the process of eliminating variables, there is strong subjectivity in the judgment of high correlation. easy to lose important variables
Because the selected variables are not typical and important variables are lost at the same time, the data analysis of the system will eventually be inaccurate, resulting in lower reliability of the system

Method used


Image

  • A data analysis method based on user information
  • A data analysis method based on user information
  • A data analysis method based on user information

Examples


Embodiment 1

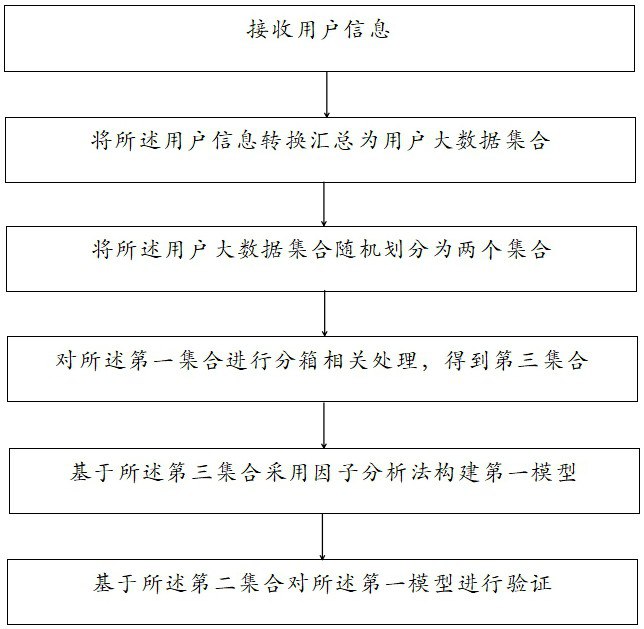
[0058] like figure 1 As shown, the present invention discloses a data analysis method based on user information, including the following steps:

[0059] Receive user information;

[0060] Summarket the user information conversion as a user's large data collection;

[0061] The set of large data sets is randomly divided into two sets, the two sets including a first set and a second set, the first set stored in the first database, the second set stored in the second database middle;

[0062] The first set of the first database is subjected to a split box correlation process, and the third set is stored in a third database;

[0063] Extract the third set in the third database, and construct a first model based on the third episode.

[0064] Extract the second set in the second database, and verify the first model based on the second set;

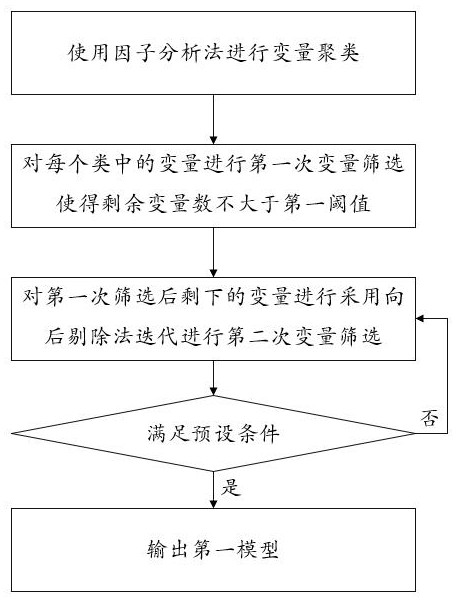
[0065] See figure 2 As shown, in which the first model is constructed based on the third epitupere, the first model is constructed, including:

[...

Embodiment 2

[0070] Based on the first example, this embodiment also includes the following:

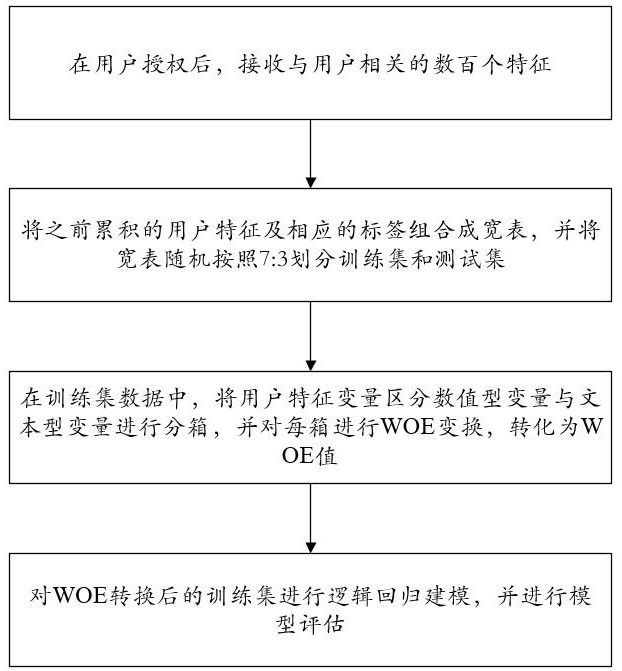
[0071] Collect users' personal information through computers or networks, and establish an evaluation model based on these collected personal information to quantify whether the user is the potential user of the value-added business, there is a risk.

[0072] The logical regression model is usually used for metrics. Logic regression is a two-class model of supervision, which converts the collected from a series of feature information (such as degree level, etc.), after the woe (Weightof evidence, evidence weights) (transform formula 1) After linearity, the value is linearly added, and the value of the sum of the SIGMOID is used to obtain a value between 0 and 1 (SIGMOID transformation is such a mapping f (x) = 1 / (1 + exp (-x) )), And this value can be used to characterize the probability of predict whether the user is trusted, and accordingly, it is determined whether or not the corresponding opera...

Embodiment 3

[0085] Based on the second embodiment, this embodiment also includes the following:

[0086] The variable of the logical regression model is generally judged by two indicators in the final regression link: p value (p-value, false value) and VIF (Variance Inflation Factor, Coefficient Diblation Coefficient) value. Where the p value reflects the significance of a single variable, the lower the P value means that the slightness of the variable is, if the P value is> 0.05, it is considered that the variable is not significant, and the VIF value reflects the variables from the model. The degree of co-linearity, the higher the VIF value, the larger the total linearity, generally if the VIF value> 4, it is considered that there is a common linearity in the model, and the variable needs to be adjusted.

[0087] Among them, the VIF represents the total linear coefficient of the model, its formula is

[0088] VIF = 1 / (1-r 2 ), Where R is the index correlation coefficient of the independen...


PUM


Abstract

The invention relates to a data analysis method and system based on user information. The method includes the following steps: receiving user information; converting and summarizing the user information into a user big data set; randomly dividing the user big data set into two sets, the two sets including the first set and the second set set; performing binning and correlation processing on the first set to obtain a third set; constructing a first model based on the third set using factor analysis; and verifying the first model based on the second set. Compared with the prior art, the present invention eliminates collinearity while retaining precision as much as possible by using the factor analysis method, and avoids simply retaining a certain most representative variable in the cluster in order to eliminate collinearity (for example, with Principal component correlation is the largest) and important variables and precision are lost, thereby improving the accuracy of data analysis.

Description

Technical field [0001] The present invention is a large data analysis and data mining, and more particularly relates to a data analysis method and system based on the user information. Background technique [0002] With the development of mobile communication technology, more and more types of mobile communication services, the demand for communications resources has also increased rapidly, but the limited resources currently available wireless communications, how rational allocation of resources in a multi-user multi-service conditions, improve wireless resource use efficiency, research is hot and difficult field of mobile communications, and a key issue in radio resource scheduling procedure is to determine the user priority. [0003] Determine the user's priority is a multi-objective problem solving, users need to consider the use of resources constrained multiple targets fairness, radio resource efficiency, system throughput, quality of service and so on. Currently the user p...

Claims


Application Information

Patent Timeline
Patent Type & Authority Patents(China)
IPC IPC(8): H04W8/18H04W72/12G06K9/62
CPCH04W8/183G06F18/2115G06F18/23H04W72/566
Inventor 邵俊蔺静茹张磊曹新建支磊
Owner 索信达(北京)数据技术有限公司
Why Eureka
Try Eureka