Tea soup color quantitative evaluation method based on image processing technology
An image processing and tea soup technology, which is applied in the field of quantitative evaluation of tea soup color, can solve problems such as strong subjectivity, lack, and poor consistency, and achieve the effect of avoiding subjectivity and uncertainty and achieving good consistency.
Pending Publication Date: 2020-11-24
YUNNAN AGRICULTURAL UNIVERSITY
View PDF4 Cites 0 Cited by
- Summary
- Abstract
- Description
- Claims
- Application Information
AI Technical Summary
Problems solved by technology
The method of sensory evaluation is relatively simple, but the result of sensory evaluation is determined by the senses and experience
Method used
View moreImage
Smart ImageViewing Examples

Examples
 PUM
 Abstract
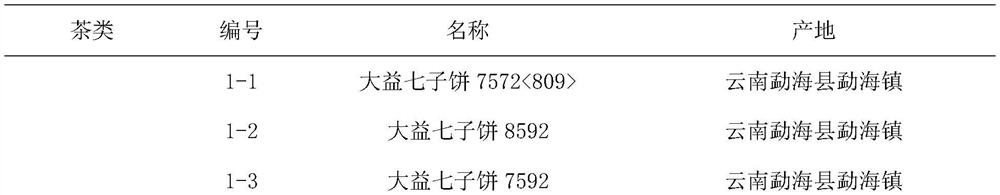
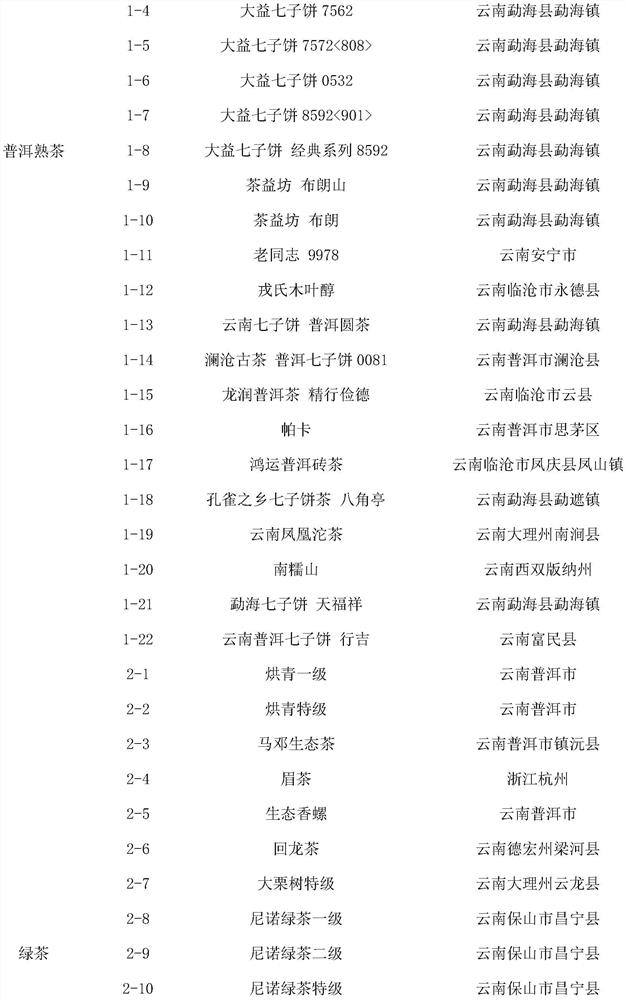
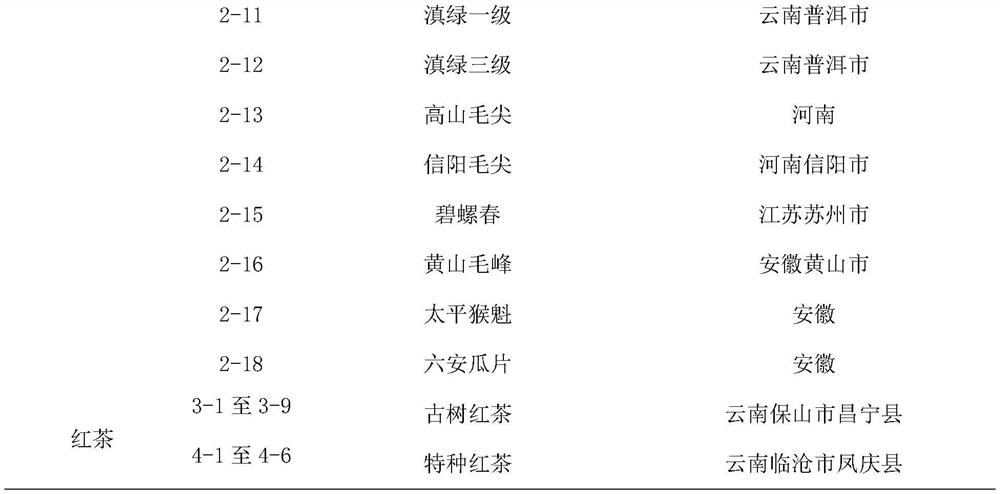
The invention discloses a tea soup color quantitative evaluation method based on an image processing technology. The method comprises the following steps: S1, weighing 3g of tea leaves according to atea-water ratio of 1: 50, brewing for 5 minutes (green tea for 4 minutes), and discharging soup; S2, draining the brewed tea soup into an evaluation bowl, and using a digital single lens reflex camerafor shooting and recording the tea soup; S3, uploading a tea sample picture obtained by photographing to the Adobe Photoshop CC 2019 to carry out data transmission and image digital processing; S4, respectively dividing the picture into four longitudinal slices and four transverse slices which are uniformly divided; and finally, respectively reading Lab values of five points 07, 12, 15, 10 and 11of the slice point by using a color picker and recording the Lab values; and S5, color and luster type evaluation. According to the method, the evaluation of the color types of the Pu'er ripe tea, the green tea and the black tea soup is quantified and standardized, the evaluation result is determined by the quantitative indexes and is not influenced by the health state and the mental state of a tea evaluator, the subjectivity and the uncertainty of sensory evaluation are avoided, and the consistency is good.
Description
technical field [0001] The invention relates to the technical field of tea evaluation (tea quality evaluation), in particular to a quantitative evaluation method of tea soup color based on image processing technology. Background technique [0002] At present, the method of tea quality evaluation is mainly sensory evaluation, and the evaluation of tea soup color is one of the important indicators for judging the quality of tea. The method of sensory evaluation is relatively simple, but the result of sensory evaluation is determined by the senses and experience of tea judges (professional tea judges). Uncertainty, strong subjectivity, poor consistency (lack of objective and scientific judgment). Contents of the invention [0003] The object of the present invention is to provide a kind of quantitative evaluation method of tea soup color based on computer image processing technology, this method is based on the three elements of Lab color model, the evaluation of the color a...
Claims
Login to View More Application Information
Patent Timeline
 IPC IPC(8): G01J3/46G06T7/12G06T7/90
CPCG01J3/46G01J3/463G06T7/90G06T7/12G06T2207/10024G06T2207/20132
Inventor 段红星李晓妍高银霞李家华刘春艳
Owner YUNNAN AGRICULTURAL UNIVERSITY
Features
- Generate Ideas
- Intellectual Property
- Life Sciences
- Materials
- Tech Scout
- Unparalleled Data Quality
- Higher Quality Content
- 60% Fewer Hallucinations
Learn More Browse by: Latest US Patents, China's latest patents, Technical Efficacy Thesaurus, Application Domain, Technology Topic, Popular Technical Reports.
© 2025 PatSnap. All rights reserved.Legal|Privacy policy|Modern Slavery Act Transparency Statement|Sitemap|About US| Contact US: help@patsnap.com