Spectrum segmentation and spectrum comparison method based on spectrum peak-splitting fitting
A technology of peak fitting and spectrum, which is applied in the field of spectral peak segmentation and spectral comparison algorithm, can solve the problems of great influence, correlation coefficient influence, misjudgment, etc., to eliminate the problem of spectral similarity calculation and improve The effect of correct judgment rate
- Summary
- Abstract
- Description
- Claims
- Application Information
AI Technical Summary
Problems solved by technology
Method used
Image
Examples
Embodiment 1
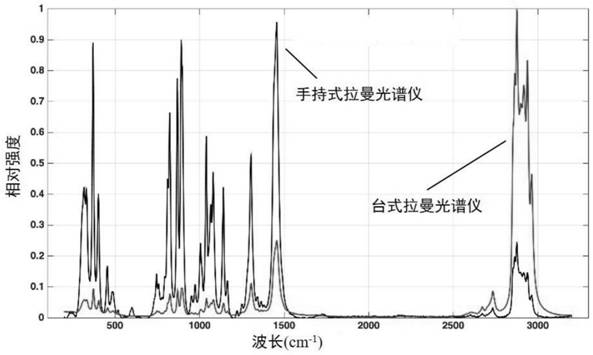
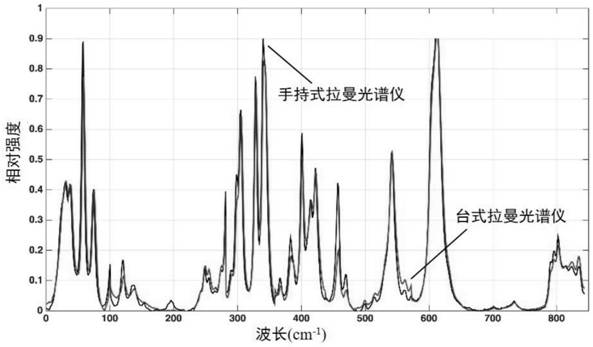
[0033] This embodiment is a comparison of the Raman spectra collected by two different types of Raman spectrometers, using the Raman spectrum data of n-hexane measured by a handheld Raman spectrometer and a desktop Raman spectrometer for comparison. The n-hexane spectrum measured by the desktop Raman spectrometer is from the Raman spectrum database and used as the standard spectrum; the n-hexane Raman spectrum measured by the handheld Raman spectrometer is used as the unknown spectrum. Firstly, corresponding preprocessing is performed on the two spectra to meet the conditions required for matching, and the spectral peaks of the unknown are fitted using the Voigt function, and the spectral peaks are segmented according to the fitting results to obtain spectral fragments, and each spectrum is recorded The wavelength start position and the wavelength end position of the segment; the Voigt function fitting is performed on the standard spectrum using the same method as described abo...
Embodiment 2
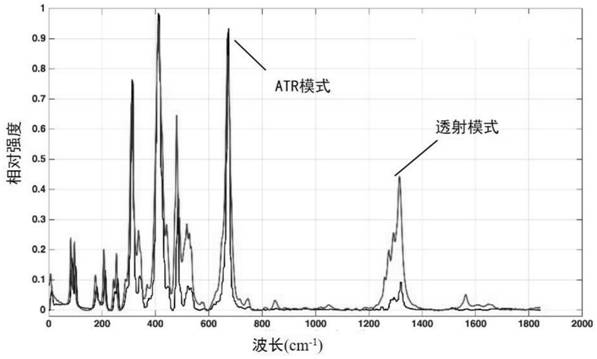
[0037]This embodiment is the comparison of two different brands and types of infrared spectrometers collecting infrared spectra, using a portable mid-infrared spectrometer (using ATR mode) and a Fourier transform mid-infrared spectrometer (using transmission mode) to measure the infrared spectrum of ethyl acetate, respectively As a comparison between the unknown spectrum and the standard spectrum, the two spectra are firstly preprocessed to meet the matching conditions, and the spectral peak of the unknown is fitted using the Voigt function. Segmentation, obtain spectral fragments, record the wavelength start position and wavelength end position of each spectral fragment; use the same method as above to perform Voigt function fitting on the standard spectrum, and use the wavelength start position and wavelength of the previously recorded spectral fragments at the same time Do the same segmentation for the end position. A least-squares fit is then performed on each pair of unkn...
Embodiment 3
[0041] In this embodiment, 257 kinds of chemical raw materials are used to measure the spectrum with a portable Raman spectrometer, and the spectral wavenumber range is 200-3200cm -1 . The standard Raman spectrum database is measured by a grating Raman spectrometer, including the Raman spectra of 14,000 compounds. Based on the spectral segmentation and spectral comparison method of spectral peak fitting of the present invention, the Raman spectra of 257 kinds of chemical raw materials are fitted, segmented, corrected, merged, and reconstructed, and all Raman spectra are unified using automatic Adaptive iteratively reweighted penalized least squares (airPLS) was used for baseline correction. The only parameter λ of airPLS was uniformly set to 1E5, and Pearson correlation coefficient was used for the calculation of spectral correlation coefficient. The matching accuracy rate of 257 spectra to be matched is 61.87% before the method is processed, and the matching accuracy rate of...
PUM
 Abstract
Description
Claims
Application Information
 - R&D
- Intellectual Property
- Life Sciences
- Materials
- Tech Scout
- Unparalleled Data Quality
- Higher Quality Content
- 60% Fewer Hallucinations
Browse by: Latest US Patents, China's latest patents, Technical Efficacy Thesaurus, Application Domain, Technology Topic, Popular Technical Reports.
© 2025 PatSnap. All rights reserved.Legal|Privacy policy|Modern Slavery Act Transparency Statement|Sitemap|About US| Contact US: help@patsnap.com


