Multi-index abnormal point overlap ratio analysis method

An analysis method and coincidence technology, applied in the field of data processing, can solve problems such as ignoring abnormal points and no analysis conclusions

Pending Publication Date: 2021-09-21
SENSOR NETWORKS TECH BEIJING CO LTD
View PDF8 Cites 0 Cited by
  • Summary
  • Abstract
  • Description
  • Claims
  • Application Information

AI Technical Summary

Problems solved by technology

[0003] However, at present, enterprises often conduct analysis based on the moment when abnormal points occur, ignoring abnormal points that have occurred in history
Therefore, after each abnormal point occurs, business hypothesis analysis is repeated, and there is no ability to quickly draw analysis conclusions based on historical analysis experience

Method used


Image

  • Multi-index abnormal point overlap ratio analysis method
  • Multi-index abnormal point overlap ratio analysis method

Examples


Embodiment Construction

[0035] In order to more clearly understand the above objects, features and advantages of the present disclosure, the solutions of the present disclosure will be further described below. It should be noted that, in the case of no conflict, the embodiments of the present disclosure and the features in the embodiments can be combined with each other.

[0036] In the following description, many specific details are set forth in order to fully understand the present disclosure, but the present disclosure can also be implemented in other ways than described here; obviously, the embodiments in the description are only some of the embodiments of the present disclosure, and Not all examples.

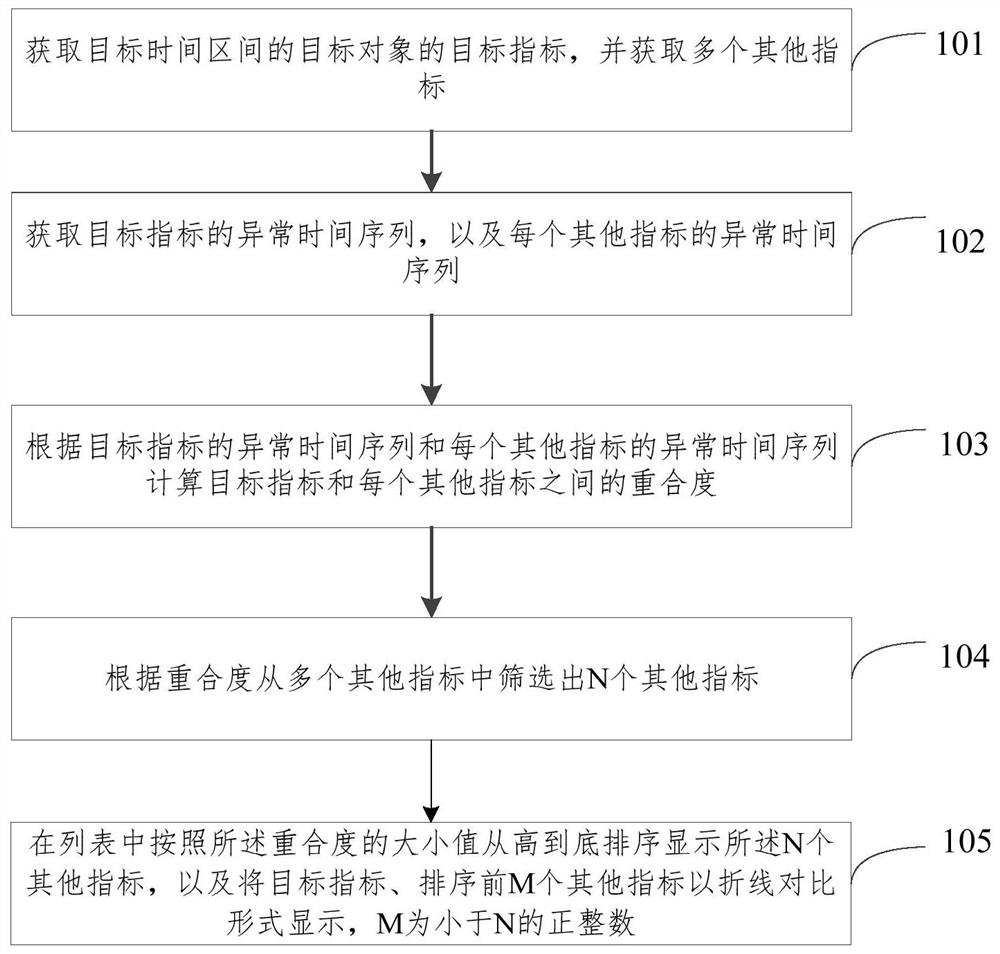
[0037] figure 1 It is a schematic flow chart of a multi-indicator abnormal point overlap analysis method described in an embodiment of the present disclosure. Such as figure 1 As shown, the method includes:

[0038] Step 101, acquire the target index of the target object in the target time in...


PUM


Abstract

The invention relates to a multi-index abnormal point coincidence degree analysis method, and relates to the field of data processing, and the method comprises the steps: obtaining a target index of a target object in a target time interval, and obtaining a plurality of other indexes; obtaining an abnormal time sequence of the target index and an abnormal time sequence of each other index; calculating the overlap ratio between the target index and each other index according to the abnormal time sequence of the target index and the abnormal time sequence of each other index; screening out N other indexes from the plurality of other indexes according to the overlap ratio; displaying the N other indexes in the list according to the overlap ratio from high to low, displaying the target index and the M other indexes before the target index in a broken line comparison mode, wherein M is a positive integer smaller than N. Therefore, aiming at a certain target index, other indexes which are highly overlapped with the time sequence of the abnormal point of the target index are checked, and other abnormal relations among different indexes are mined, so that the index abnormity can be quickly positioned subsequently.

Description

technical field [0001] The present disclosure relates to the technical field of data processing, in particular to a method for analyzing coincidence degree of multi-indicator abnormal points. Background technique [0002] At present, enterprises are particularly concerned about the abnormalities of data indicators. By analyzing the abnormal points of indicators, they can come up with ideas for enterprise optimization iterations. [0003] However, at present, enterprises often conduct analysis based on the moment when abnormal points occur, ignoring abnormal points that have occurred in history. Therefore, after each abnormal point occurs, business hypothesis analysis is repeated, and there is no ability to quickly draw analysis conclusions based on historical analysis experience. Contents of the invention [0004] In order to solve the above technical problem or at least partly solve the above technical problem, the present disclosure provides a method for analyzing coinc...

Claims


Application Information

Patent Timeline
Patent Type & Authority Applications(China)
IPC IPC(8): G06Q10/06
CPCG06Q10/06393
Inventor 桑文锋刘耀洲曹犟付力力安志远岳帅郦轩
Owner SENSOR NETWORKS TECH BEIJING CO LTD
Why Eureka
Try Eureka