
Seismic data visualization method and device

A technology of seismic data and data, which is applied in the field of mineral exploration and development data analysis, can solve the problems of inflexible display, inaccurate cutting control, clutter, etc., and achieve the effect of improving processing accuracy and solving inaccurate cutting control

Pending Publication Date: 2021-11-09
BC P INC CHINA NAT PETROLEUM CORP +1
View PDF0 Cites 0 Cited by
  • Summary
  • Abstract
  • Description
  • Claims
  • Application Information

AI Technical Summary

Problems solved by technology

[0003] The embodiment of the present invention provides a seismic data visualization method to realize the visualization of seismic data, avoid the problems of inability to flexibly display local models and various surface data information, inaccurate clipping control, and messy visual content, and improve computing efficiency and complex model processing accuracy, the method includes:

Method used


Image

  • Seismic data visualization method and device
  • Seismic data visualization method and device
  • Seismic data visualization method and device

Examples


Embodiment Construction

[0033] In order to make the purpose, technical solutions and advantages of the embodiments of the present invention more clear, the embodiments of the present invention will be further described in detail below in conjunction with the accompanying drawings. Here, the exemplary embodiments and descriptions of the present invention are used to explain the present invention, but not to limit the present invention.

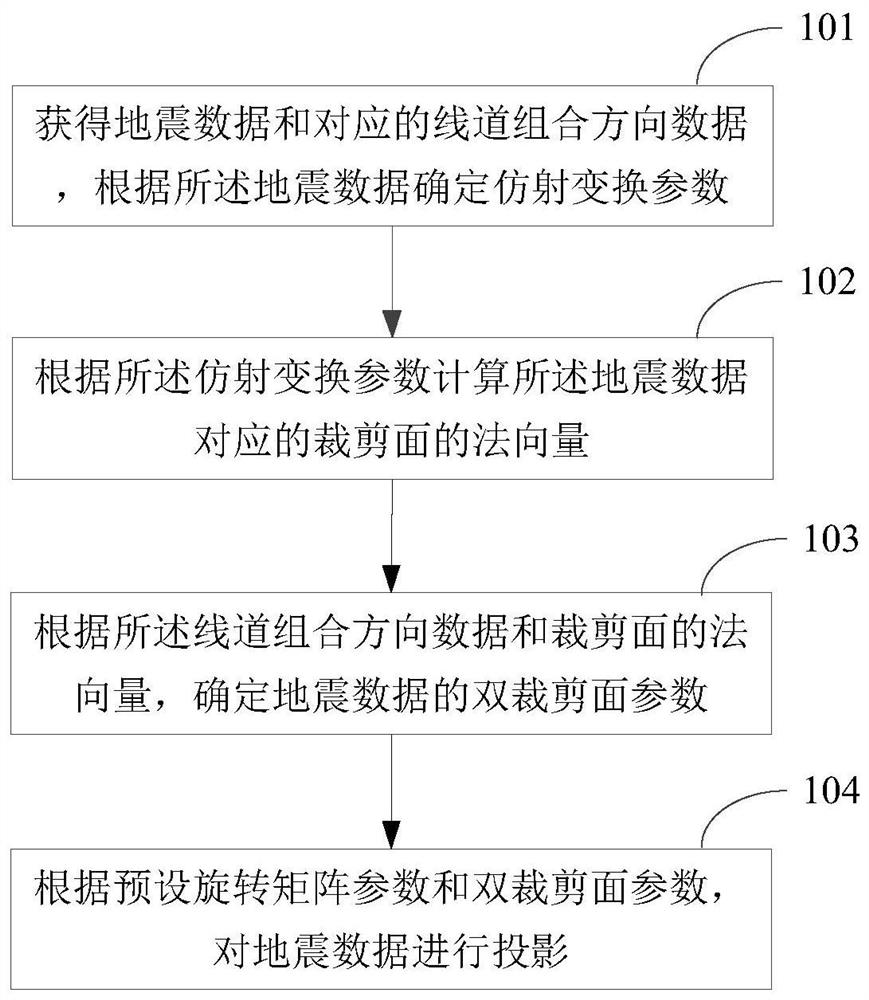
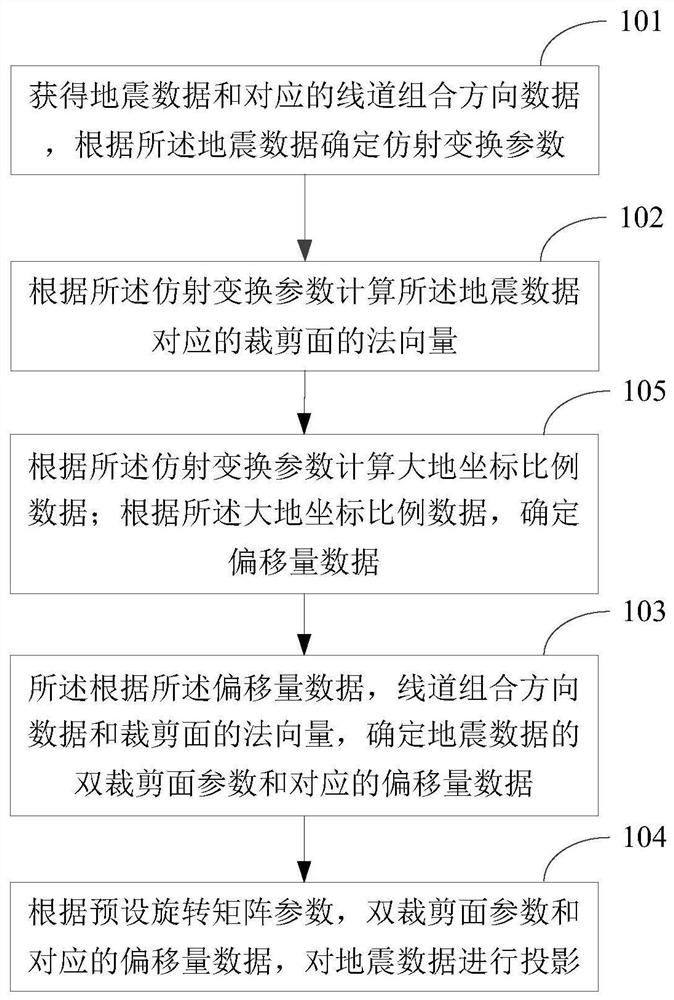
[0034] In order to realize the visualization of seismic data, avoid the problems of inability to flexibly display local models and various surface data information, inaccurate clipping control, and messy visual content, and improve calculation efficiency and complex model processing accuracy, the embodiment of the present invention provides a A seismic data visualization method, the method comprising:

[0035] Step 101. Obtain seismic data and corresponding track combination direction data, and determine affine transformation parameters according to the seismic data; ...


PUM


Abstract

The invention discloses a seismic data visualization method and device. The method comprises the steps of: obtaining seismic data and corresponding line channel combination direction data, and determining affine transformation parameters according to the seismic data; calculating a normal vector of a cutting surface corresponding to the seismic data according to the affine transformation parameters; determining double cutting surface parameters of the seismic data according to the line channel combination direction data and the normal vector of the cutting surface; and projecting the seismic data according to preset rotation matrix parameters and the double cutting surface parameters. According to the method, the visualization of seismic data is effectively realized, the problems of incapability of flexibly displaying local models and information of various curved surface data, inaccurate cutting control and disordered visual content are avoided, and the calculation efficiency and the complex model processing accuracy are improved.

Description

technical field [0001] The invention relates to the technical field of mineral exploration and development data analysis, in particular to a seismic data visualization method and device. Background technique [0002] With the further deepening of mineral exploration and development, the requirements for visual analysis of complex seismic data are also getting higher and higher. In the prior art, the visualization of seismic data is usually realized by two-dimensional display technology or the technology of simulating two-dimensional display by using the clipping surface function of three-dimensional visualization. Among them, two-dimensional display technology can accurately display local information, but cannot flexibly display local information. Model and various surface data information, and there are problems such as low calculation efficiency and high error rate in complex model processing. However, the technology of simulating two-dimensional display by using the clip...

Claims


Application Information

Patent Timeline
Patent Type & Authority Applications(China)
IPC IPC(8): G01V1/34
CPCG01V1/345G01V2210/74
Inventor 钱宇明白雪莲崔京彬吴蜀燕张理慧邓丽
Owner BC P INC CHINA NAT PETROLEUM CORP
Learn More