Method for detecting axial pore distribution of cigarette
A technology of axial porosity and detection method, applied in the direction of suspension and porous material analysis, measuring device, analysis material, etc.
- Summary
- Abstract
- Description
- Claims
- Application Information
AI Technical Summary
Problems solved by technology
Method used
Image
Examples
Embodiment 1
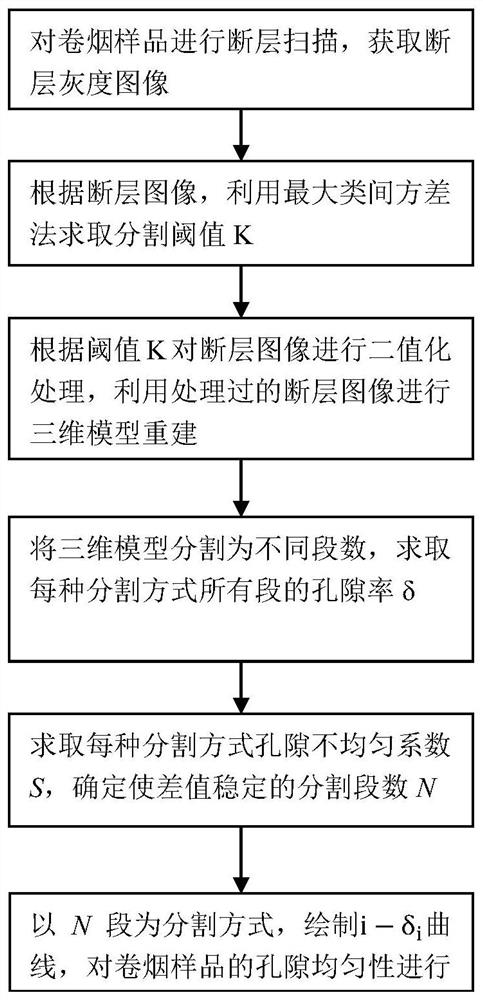
[0042] The detection method of cigarette axial pore distribution of the present embodiment, flow chart is as follows figure 1 shown, including the following steps:
[0043] (1) Perform tomographic scanning on the cigarette section of the cigarette sample to obtain a tomographic grayscale image
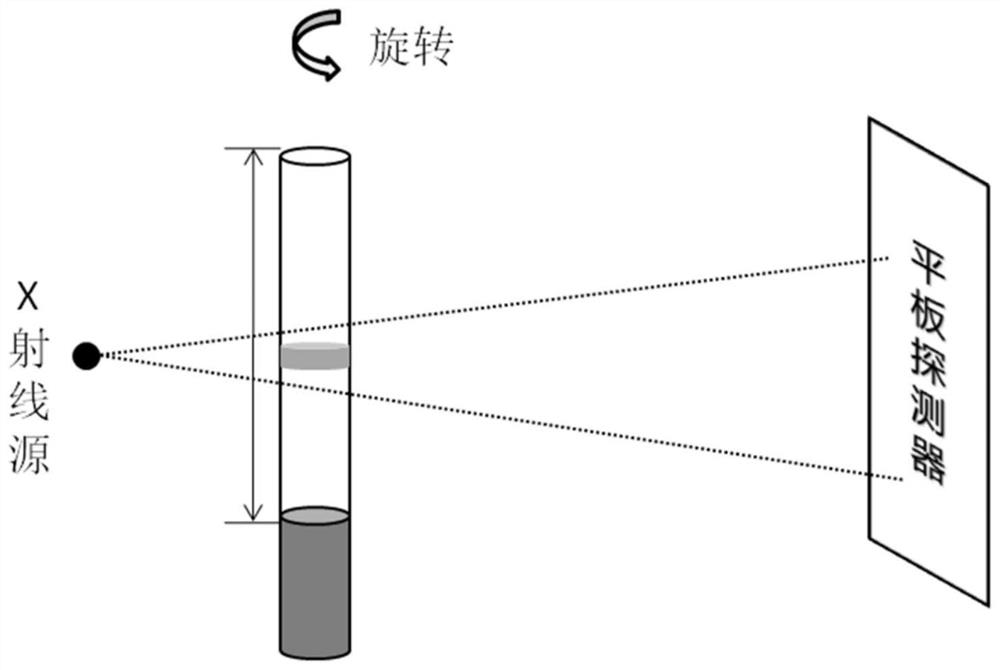
[0044] use as figure 2 The shown tomography system performs tomography, and the tomography system consists of a micro-focus X-ray source, a digital flat-panel detector, and a high-precision turntable.
[0045] When working, use the emission source and the highly sensitive detector to scan the cross-section of the sample to be tested at different positions, and obtain the grayscale image of the sample without loss. The grayscale value in the image corresponds to the material density in the sample. The components and densities of the ray attenuation are different, corresponding to different gray values on the reconstructed image.
[0046] In order to eliminate the influence of the ...
Embodiment 2
[0081] The method for detecting the axial pore distribution of cigarettes in this embodiment, the main steps are described as follows, and other steps not described are the same as in Embodiment 1.
[0082] Step (1): γ-rays are used as the ray source, and the resolution is set to 30 microns. The cigarette sample is laid down (flat scanning) to collect axial tomographic grayscale images. The tomographic scanning system and the embodiment 1 can use the same platform. The collected grayscale image needs to cut out the filter segment image.
[0083] Step (2): Draw a grayscale histogram, the air peak is on the far left of the histogram, and the gray value corresponding to the trough between the leftmost peak and the second left peak is selected as the segmentation threshold K.
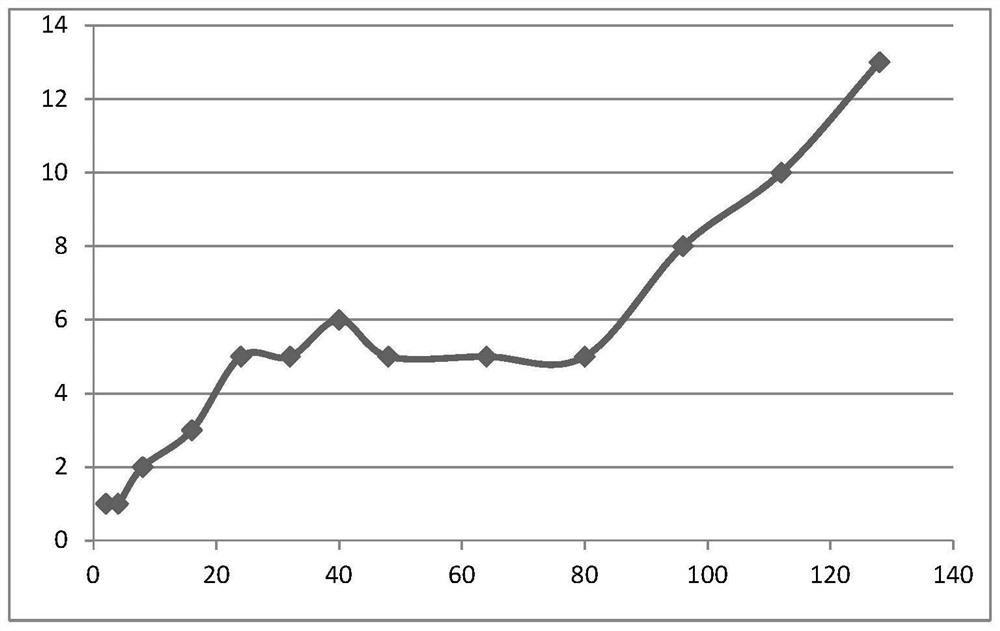
[0084] Step (5): Divide the 3D reconstruction model into 2 segments, 4 segments, 8 segments, 12 segments, ..., 128 segments on average (the arithmetic difference method is adopted after 4 segments). Count ...
Embodiment 3
[0091] The difference between the detection method of the axial pore distribution of the cigarette in this embodiment and that of Embodiment 1 will be described as follows, and other steps not described are the same as those of Embodiment 1.
[0092] In step (2), a grayscale histogram is drawn, the air peak is on the far left of the histogram, and the gray value corresponding to the trough between the leftmost peak and the second left peak is selected as the segmentation threshold K.
PUM
| Property | Measurement | Unit |
|---|---|---|
| pore size | aaaaa | aaaaa |
Abstract
Description
Claims
Application Information
 - R&D
- Intellectual Property
- Life Sciences
- Materials
- Tech Scout
- Unparalleled Data Quality
- Higher Quality Content
- 60% Fewer Hallucinations
Browse by: Latest US Patents, China's latest patents, Technical Efficacy Thesaurus, Application Domain, Technology Topic, Popular Technical Reports.
© 2025 PatSnap. All rights reserved.Legal|Privacy policy|Modern Slavery Act Transparency Statement|Sitemap|About US| Contact US: help@patsnap.com


