Picture table line extraction model construction method and picture table extraction method

A technology of construction method and extraction method, applied in the field of graphic extraction, can solve cumbersome and complex problems, achieve the effect of good recognition effect, reduce errors, and improve the accuracy of the model

Pending Publication Date: 2022-06-03
SEPCO ELECTRIC POWER CONSTR CORP
View PDF0 Cites 0 Cited by
  • Summary
  • Abstract
  • Description
  • Claims
  • Application Information

AI Technical Summary

Problems solved by technology

[0010] The purpose of the present invention is to aim at the test results of the U-Net and U-Net++ models in the prior art, which have their own advantages and disadvantages, and at the same time, the labeling method of the table lines in the image is too cumbersome and complicated, and proposes a picture table line extraction model Construction method and image table extraction method, thereby reducing the difficulty of marking table line pixels, and combining the advantages of U-Net and U-Net++ models to more accurately extract graphic table lines

Method used


Image

  • Picture table line extraction model construction method and picture table extraction method
  • Picture table line extraction model construction method and picture table extraction method
  • Picture table line extraction model construction method and picture table extraction method

Examples


Embodiment 1

[0049] This example builds an image table extraction model, including the following steps:

[0050] Step 1: Select training data; build a dataset.

[0051]Traditional region-based semantic segmentation methods first extract free-form regions from an image and describe their features, then classify them based on regions, and finally convert region-based predictions to pixel-level predictions using pixel-inclusive classification categories. The highest scoring regions are used to label pixels. This method needs to generate a large number of candidate regions, which takes a lot of time and memory space. However, using this method to mark the line segment area in the picture will cause the pixels of the line segment area and the line segment edge area to overlap, the marking effect is not good, and the marking is too cumbersome and complicated.

[0052] In this example, the image containing the table is analyzed, each table line is marked with a line segment of a preset width, an...

Embodiment 2

[0065] This example is based on the model constructed in Example 1, and describes the selection of its loss function, as follows:

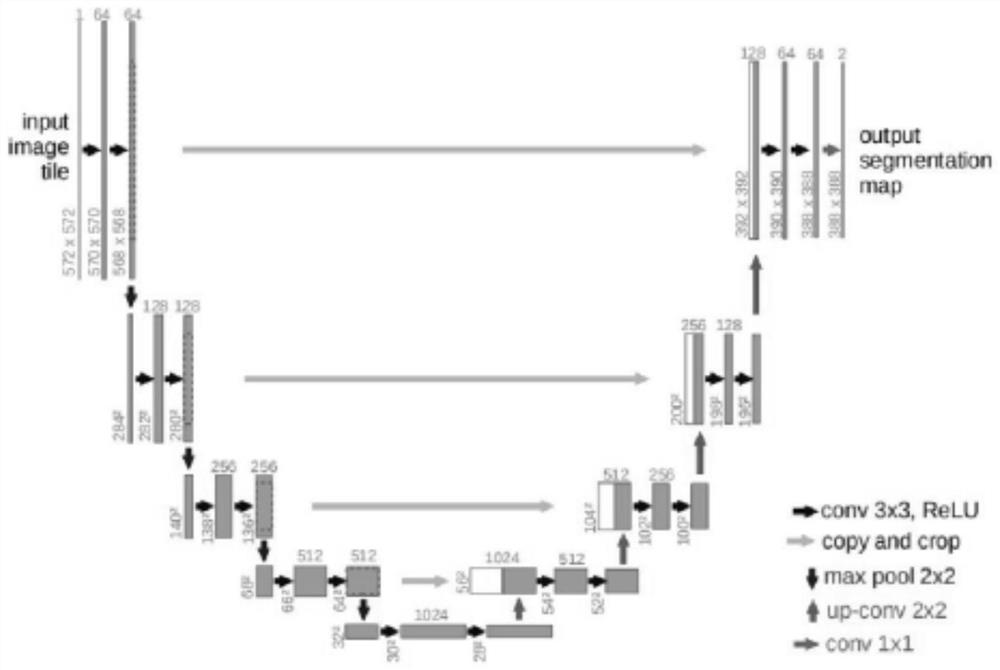
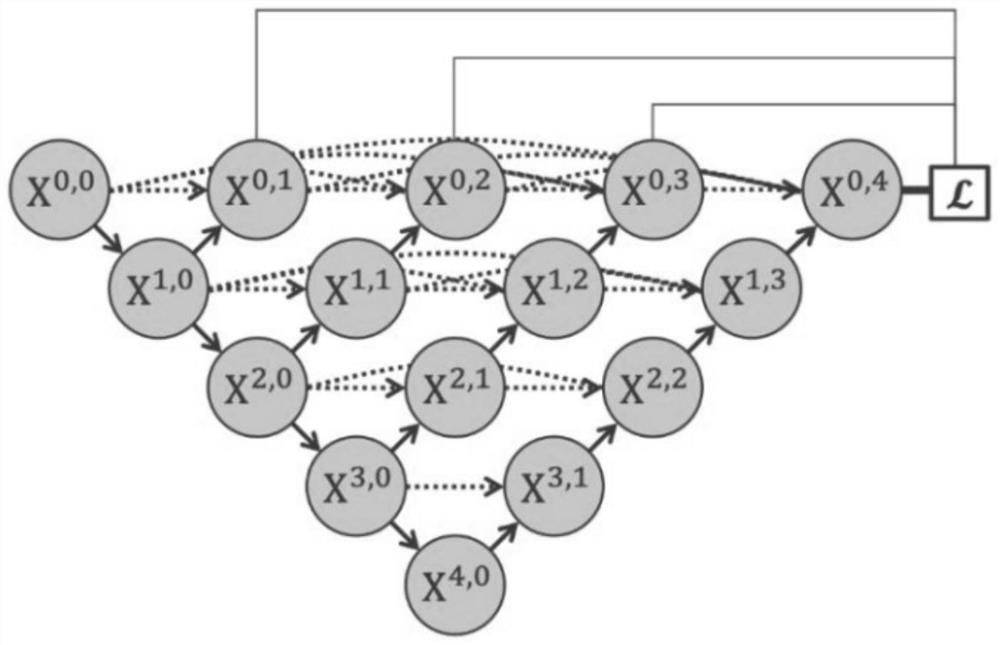
[0066] (1) The U-Net and U-Net++ models are both image semantic segmentation models, which are pixel-level classification tasks. The most commonly used loss function for image semantic segmentation tasks is the cross entropy loss function, which is calculated as follows:

[0067] row loss=-∑y true log(y pred )

[0068] As you can see from this cross-entropy loss function, when y true is 0, that is, the loss of pixels not marked as horizontal lines in the input is 0, only when y true When it is 1, that is, the loss value exists only when the pixels in the input are marked as horizontal lines, so if this cross entropy loss function is used for calculation, the loss of most pixels will be discarded, resulting in poor model training effect. good.

[0069] (2) In order to solve the above problems, a binary cross-entropy loss function, namely BCE L...

Embodiment 3

[0078] This example provides a method for extracting picture table information. The process of extracting picture table information based on deep learning includes the following steps:

[0079] Step 1: Perform layout analysis on the picture and extract the table area.

[0080] For a picture, it may contain one or more tables, or it may not contain tables, so it is necessary to find the table area in the picture before extracting the table lines and reconstructing the table.

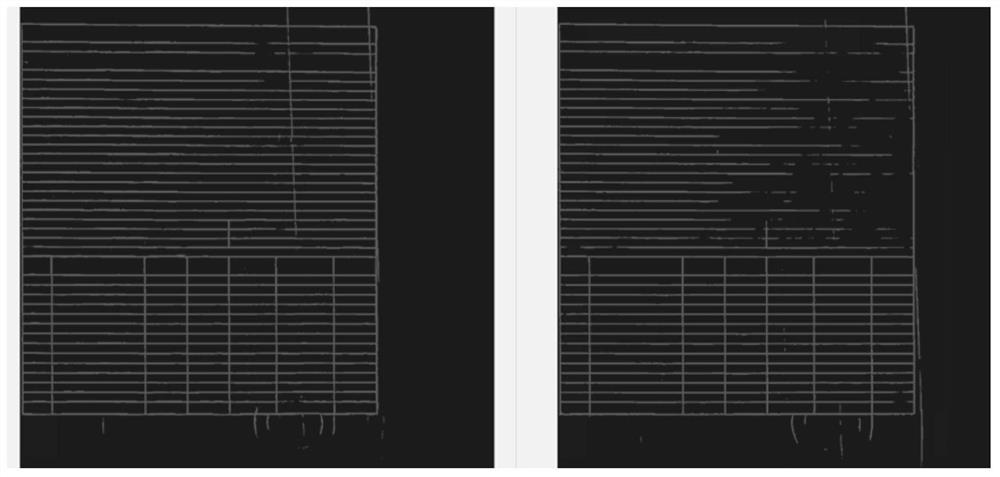
[0081] Step 2: Build any one of the image table extraction models in Embodiment 1, apply it to table extraction for each table area, determine the category of each pixel in the area, and determine table lines. The specific model selection has been specifically described in Embodiment 1, and will not be repeated here.

[0082] This example uses the integrated model based on U-Net and U-Net++, and the output probability of U-Net and U-Net++ is directly added or weighted as the final output of the model. W...


PUM


Abstract

The invention relates to the field of graph extraction. The invention provides a picture table line extraction model construction method, which comprises the following steps of: firstly, selecting training data; the method comprises the following steps: analyzing an image containing a table, marking each table line by using a line segment with a preset width, and marking pixel points on the line segment; the unmarked part is regarded as a background part; secondly, constructing a data set by using the training data; randomly splitting any data set into a training set and a test set; then, constructing a U-Net model, a U-Net + + model or an integrated model of the U-Net and the U-Net + +, and training the models by adopting the training set; and stopping training until the prediction performance of the model reaches a preset value through the test of the test set, and completing the construction of the picture table line extraction model. Therefore, the construction difficulty of the training set is reduced, the advantages of the U-Net model and the U-Net + + model are combined, and the graph table is extracted more accurately.

Description

technical field [0001] The invention belongs to the field of graphic extraction, and in particular relates to a method for constructing a picture table line extraction model and a method for extracting a picture table. Background technique [0002] There are currently existing methods for identifying image tables: [0003] (1) Traditional method: Based on the image processing method of OpenCV, the horizontal and vertical lines in the picture are extracted by using erosion and expansion operations on the picture, and then the horizontal and vertical lines are superimposed to form a table structure. The coordinates of an intersection point, extract the outline of the formed table and then use polygon fitting to obtain the outer border of the table. The outline of all connected areas in the table is extracted to determine the position and size of each cell in the table, and finally the structure of the table is determined according to the outer border and cell of the table and...

Claims


Application Information

Patent Timeline
IPC IPC(8): G06V30/414G06V30/412G06K9/62G06V10/774
CPCG06F18/214
Inventor 孙丰茂闫腾许永安罗来丰
Owner SEPCO ELECTRIC POWER CONSTR CORP
Why Eureka
Try Eureka