Multi-dimensional comprehensive display visual data display platform
A data display and platform technology, applied in visual data mining, structured data browsing, structured data retrieval, etc., can solve problems such as low integration of multiple data sources and single dimension
- Summary
- Abstract
- Description
- Claims
- Application Information
AI Technical Summary
Problems solved by technology
Method used
Image
Examples
Embodiment 1
[0058] The invention discloses a multi-dimensional comprehensive display visual data display platform, which specifically includes a power data multi-dimensional expression module, which is used to provide several power data expression methods; The algorithm optimizes the power data expression method; the power data multidimensional expression feature extraction module, the power data multidimensional expression feature extraction module is used to extract the visual features of the optimized power data; the power data multidimensional expression feature fusion module, the power data multidimensional expression feature fusion Modules are used to fuse visual features and traditional features. Power data expression methods include two-dimensional vector display, star plane display, star coordinate display, radar data display and color data display.
Embodiment 2
[0060] The two-dimensional vector display includes: a data contains N-dimensional attribute values, and its attribute points are drawn on n parallel coordinate axes with equal distances, then the drawing formula of its parallel coordinates can be expressed as:
[0061]
[0062] Available: x i+1 =m i x i +b i i=1,2,3,...,n-1
[0063] where m i represents the slope m i =μ i +1 / μ i , b i means x i+1 Intersection b with the vertical axis i =a i+1 -m i a i , assuming that the distance of the vertical parallel coordinate axis is 1, that is, a i =1, i=1,2,3,...,n, then the coordinate point represented by the parallel coordinates in the two-dimensional space is:
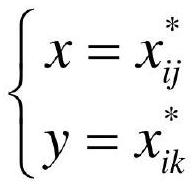
[0064]
[0065] Among them, optimizing the two-dimensional vector display includes: selecting a data in the high-dimensional data set as the starting point P 1 , the ordinate value of this point is the smallest point in the data value, calculate P 1 After connecting with other points, the angle between...
Embodiment 3
[0103] The goal of feature selection is to select a set of optimal features with dimension d(d> and different features have different recognition effects in different data sets, so We want to perform feature selection optimization on the features of the visualization graph to find a set of optimal feature combinations. From the point of view of algorithm, visual graph feature selection is divided into: filter algorithm and global optimization algorithm. After the extraction of visual features, the classical dataset features are merged with the newly extracted visual features, which will generate a feature set with a very large dimension, while the actual classification and clustering process does not require so many dimensional features. If the dimension of data features is too large, the recognition process will consume a lot of time and may be oversaturated.
[0104] In various embodiments, the hardware implementation of the technology may directly use existing smart device...
PUM
 Abstract
Description
Claims
Application Information
 - R&D
- Intellectual Property
- Life Sciences
- Materials
- Tech Scout
- Unparalleled Data Quality
- Higher Quality Content
- 60% Fewer Hallucinations
Browse by: Latest US Patents, China's latest patents, Technical Efficacy Thesaurus, Application Domain, Technology Topic, Popular Technical Reports.
© 2025 PatSnap. All rights reserved.Legal|Privacy policy|Modern Slavery Act Transparency Statement|Sitemap|About US| Contact US: help@patsnap.com


