Electronic blood pressure monitor, and blood pressure measurement data processing apparatus and method
An electronic sphygmomanometer and data processing technology, applied in the direction of electrical digital data processing, special data processing applications, calculations, etc., can solve the problems of displaying dangerous methods, not being open, etc.
- Summary
- Abstract
- Description
- Claims
- Application Information
AI Technical Summary
Problems solved by technology
Method used
Image

Examples
example 1
[0117] exist Figure 7 Among them, the display unit 4 includes display areas 51 and 52 for simultaneously displaying the measurement data after waking up and the measurement data before going to bed in parallel, respectively. On the display area 51 , the average SBP data 61 measured after waking up, the average DBP data 62 measured after waking up, and the PLS average PLS data 63 measured after waking up obtained by the average value calculation unit 23 according to the above formula are respectively displayed. Then, in parallel with these, the pre-sleep measurement SBP average data 71 , the pre-sleep measurement DBP average data 72 , and the pre-sleep measurement PLS average data 73 obtained by the average value calculation unit 23 according to the above formula are displayed on the display area 52 . Accordingly, the measurement data on the display areas 51 and 52 are displayed in a state of being related to each other.
[0118] The risk value calculation and determination u...
example 2
[0126] exist Figure 10 Among them, the display unit 4 includes display areas 51 and 53 . On the display area 51 , for example, SBP average data 61 measured after waking up, DBP average data 62 measured after waking up, and PLS average data 63 measured after waking up are displayed. The average data displayed in the display area 51 by the risk value calculation and determination unit 24, the result of comparison with the reference values (135mmHg, 85mmHg) for risk determination, or the average value of the measurement data before going to bed are displayed on the display area 53. The results for comparison are also available. Squares 81 to 84 for displaying comparison results are displayed on the display area 53 . The display of squares 81-84 in the display area 53 is, for example, Figures 11A-11D shown.
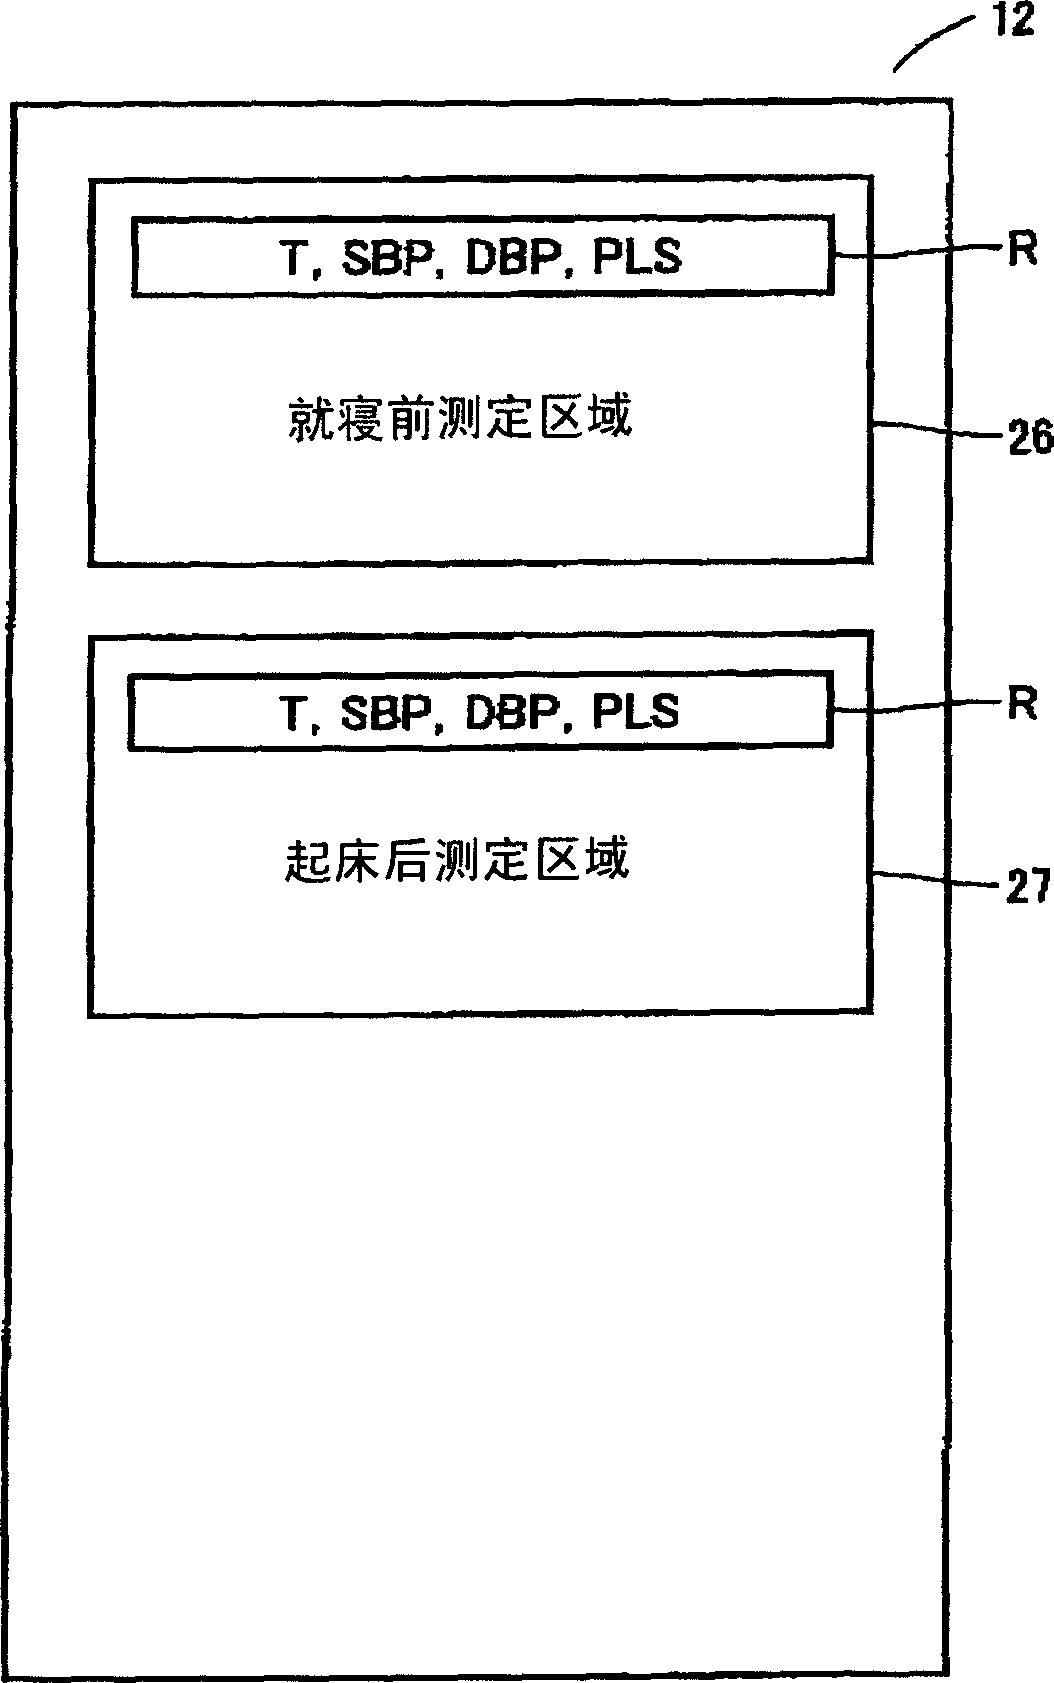
[0127] in progress Figure 10 When displayed as shown, the average value calculation unit 23 reads the measurement data from the areas 26 and 27 for each of the diff...
example 3
[0133] Figure 12 express Figure 10 Other display states of squares 81-84 in the display area 53 of . The display states of the squares 81 to 84 in the display area 53 are shown in Figure 13A ~ Figure 13D middle. The operation of the average value calculation unit 23 is the same as Figure 10 The situation is the same.
[0134] exist Figure 13A In , the comparison result between the measured blood pressure value and the reference value 80 is displayed. For example, when it is determined that the above-mentioned predetermined relationship is established with respect to the relative reference value 80 of the measured SBP average data 61 after getting up and the average DBP data 62 measured after getting up displayed on the display area 51 (that is, the Blood pressure is higher than the reference value 80), and any one of the SBP average data 71 measured before bedtime and the DBP average data 72 measured before bedtime, or both of them do not establish the above-mention...
PUM
 Abstract
Description
Claims
Application Information
 - R&D
- Intellectual Property
- Life Sciences
- Materials
- Tech Scout
- Unparalleled Data Quality
- Higher Quality Content
- 60% Fewer Hallucinations
Browse by: Latest US Patents, China's latest patents, Technical Efficacy Thesaurus, Application Domain, Technology Topic, Popular Technical Reports.
© 2025 PatSnap. All rights reserved.Legal|Privacy policy|Modern Slavery Act Transparency Statement|Sitemap|About US| Contact US: help@patsnap.com