Automated provisioning of relational information for a summary data visualization

a technology of summary data and automatic provisioning, applied in the field of system and method of displaying information to a user, can solve the problems of cumbersome analysis of raw data, user lack of proper context to process and use information, and time-consuming research and/or inquiry, and achieve the effect of rapid and concise conveying

Active Publication Date: 2018-06-19
DOMO
View PDF335 Cites 4 Cited by
  • Summary
  • Abstract
  • Description
  • Claims
  • Application Information

AI Technical Summary

Benefits of technology

[0004]Data visualizations include all ways of graphically representing numerical data, including charts, graphs, infographics, and maps. Data visualizations are widely used to rapidly and concisely convey relationships between and among the various data in a data set. For example, in the contex...

Problems solved by technology

Analyzing the raw data may be cumbersome, but a graph of sales revenue over time can rapidly convey comparative performance, sales trends over time, and other useful information to a user such as a business executive.
Thus, although the summary data visualization may efficiently present information to the user, the user may be lacking the proper context to process and use the information.
The process of putting the summary data in context may require time-consumin...

Method used


Image

  • Automated provisioning of relational information for a summary data visualization
  • Automated provisioning of relational information for a summary data visualization
  • Automated provisioning of relational information for a summary data visualization

Examples


examples

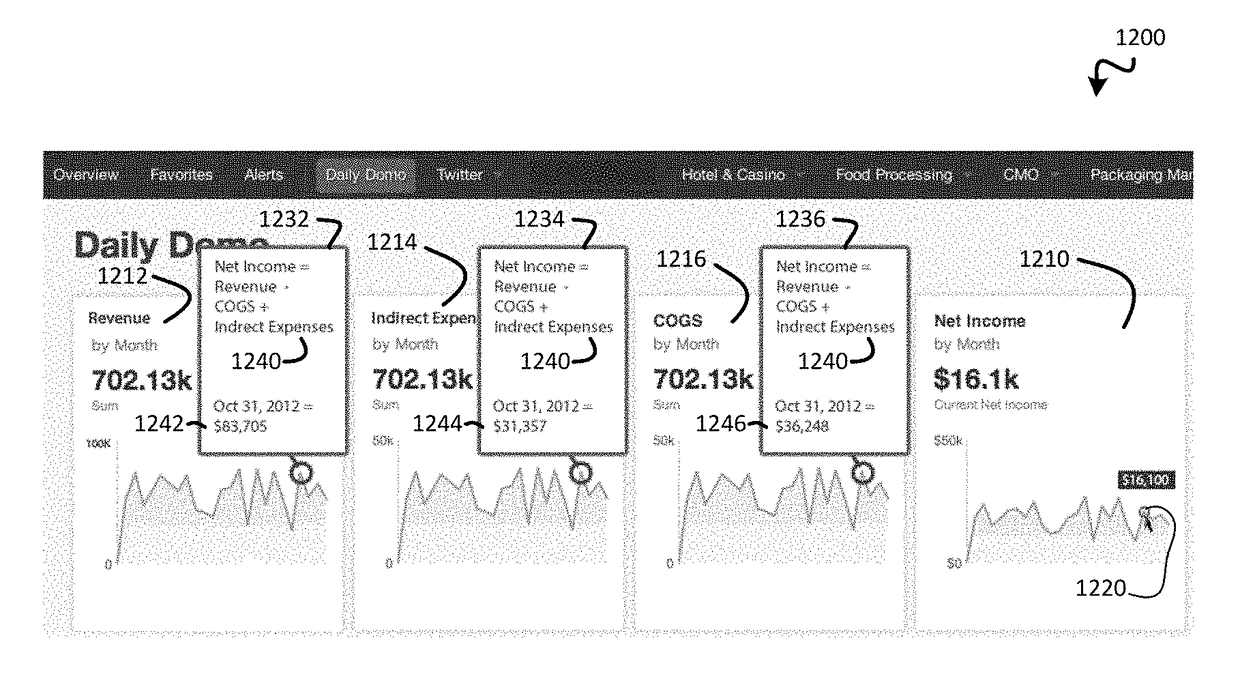
[0150]A wide variety of data visualizations, triggers, selection methods, information displays, and other aspects may be varied to generate a wide variety of embodiments of the invention. The following examples are presented by way of illustration and not limitation to indicate some of the ways in which a system, such as the system 400 of FIG. 4, may show and / or draw attention to information related to constituent data and / or navigational elements, according to the invention. For purposes of the discussion below, it will be assumed that the user 100 provides a trigger selecting the portion of the summary data visualization for which constituent information is desired.

[0151]FIGS. 11A and 11B are screen shots 1100, 1150, respectively, depicting the display of information related to constituent data according to one example of the invention. More precisely, FIGS. 11A and 11B depict an example of highlighting a related measure with a formula relationship. FIG. 11A depicts the view that ...


PUM


Abstract

A related information provision system may be used to identify constituent data for a selected portion of summary data on a summary data visualization such as a chart or graph. The portion of the summary data may be selected by a user, a system event, and/or another process. The constituent data may include values and/or metadata for one or more data sets summarized by the summary data, formulas and/or other information, which may indicate how the summary data are obtained from the constituent data. Information regarding the constituent data (“related information”) may be displayed for a user on a constituent visualization or the like. If the information is already displayed, the system may draw the user's attention to the information. If the information is displayed in a different view, the system may display a navigational element leading to it, or direct the user's attention to an existing navigational element.

Description

CROSS-REFERENCES TO RELATED APPLICATIONS[0001]The present application claims priority from U.S. Provisional Application Ser. No. 61 / 763,325 for “Related Measure Highlighting,” filed Feb. 11, 2013, which is incorporated by reference herein in its entirety.[0002]The present application further claims priority as a continuation-in-part of U.S. Utility application Ser. No. 13 / 535,019 for “Dynamic Expansion of Data Visualizations,” filed Jun. 27, 2012, which claims priority from U.S. Provisional Application Ser. No. 61 / 506,912 for “Drill by Expansion,” filed Jul. 12, 2011. Both applications are incorporated by reference herein in their entirety.FIELD OF THE INVENTION[0003]The present invention relates to systems and methods for displaying information to a user, and more particularly, displaying information regarding constituent data used to obtain summary data provided to a user.DESCRIPTION OF THE RELATED ART[0004]Data visualizations include all ways of graphically representing numerical...

Claims


Application Information

Patent Timeline
IPC IPC(8): G06F3/0481G06F17/30G06F3/0484G06T11/20
CPCG06F3/0484G06F3/0481G06F17/30572G06T11/206G06F16/26
Inventor BURTENSHAW, JEFFWINTERS, ALAN
Owner DOMO
Why Eureka
Try Eureka