
Method for analyzing a signal as well as measurement and analyzing device

a signal analysis and signal technology, applied in the direction of measurement devices, digital variable displays, instruments, etc., can solve the problem of user unintentional anomalies, and achieve the effect of high flexibility

Active Publication Date: 2020-07-14
ROHDE & SCHWARZ GMBH & CO KG
View PDF6 Cites 0 Cited by
  • Summary
  • Abstract
  • Description
  • Claims
  • Application Information

AI Technical Summary

Benefits of technology

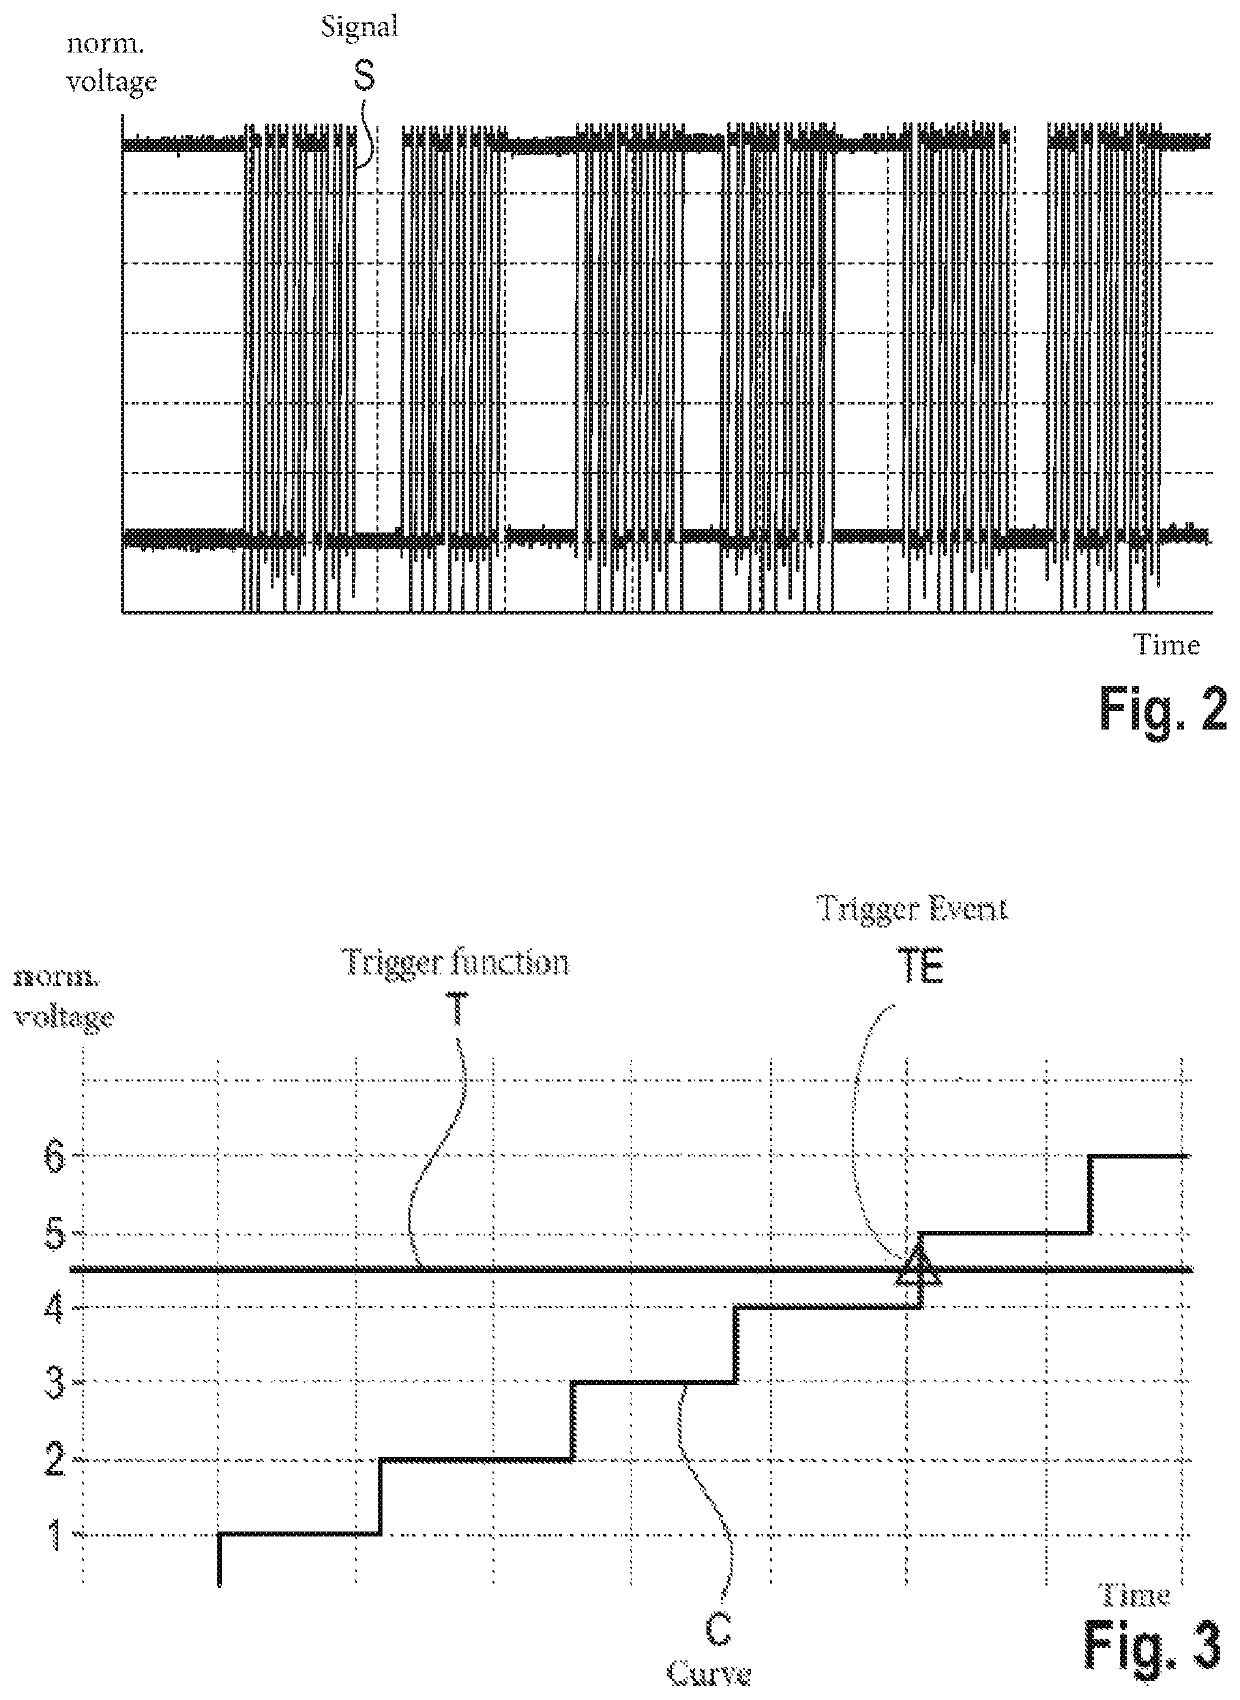
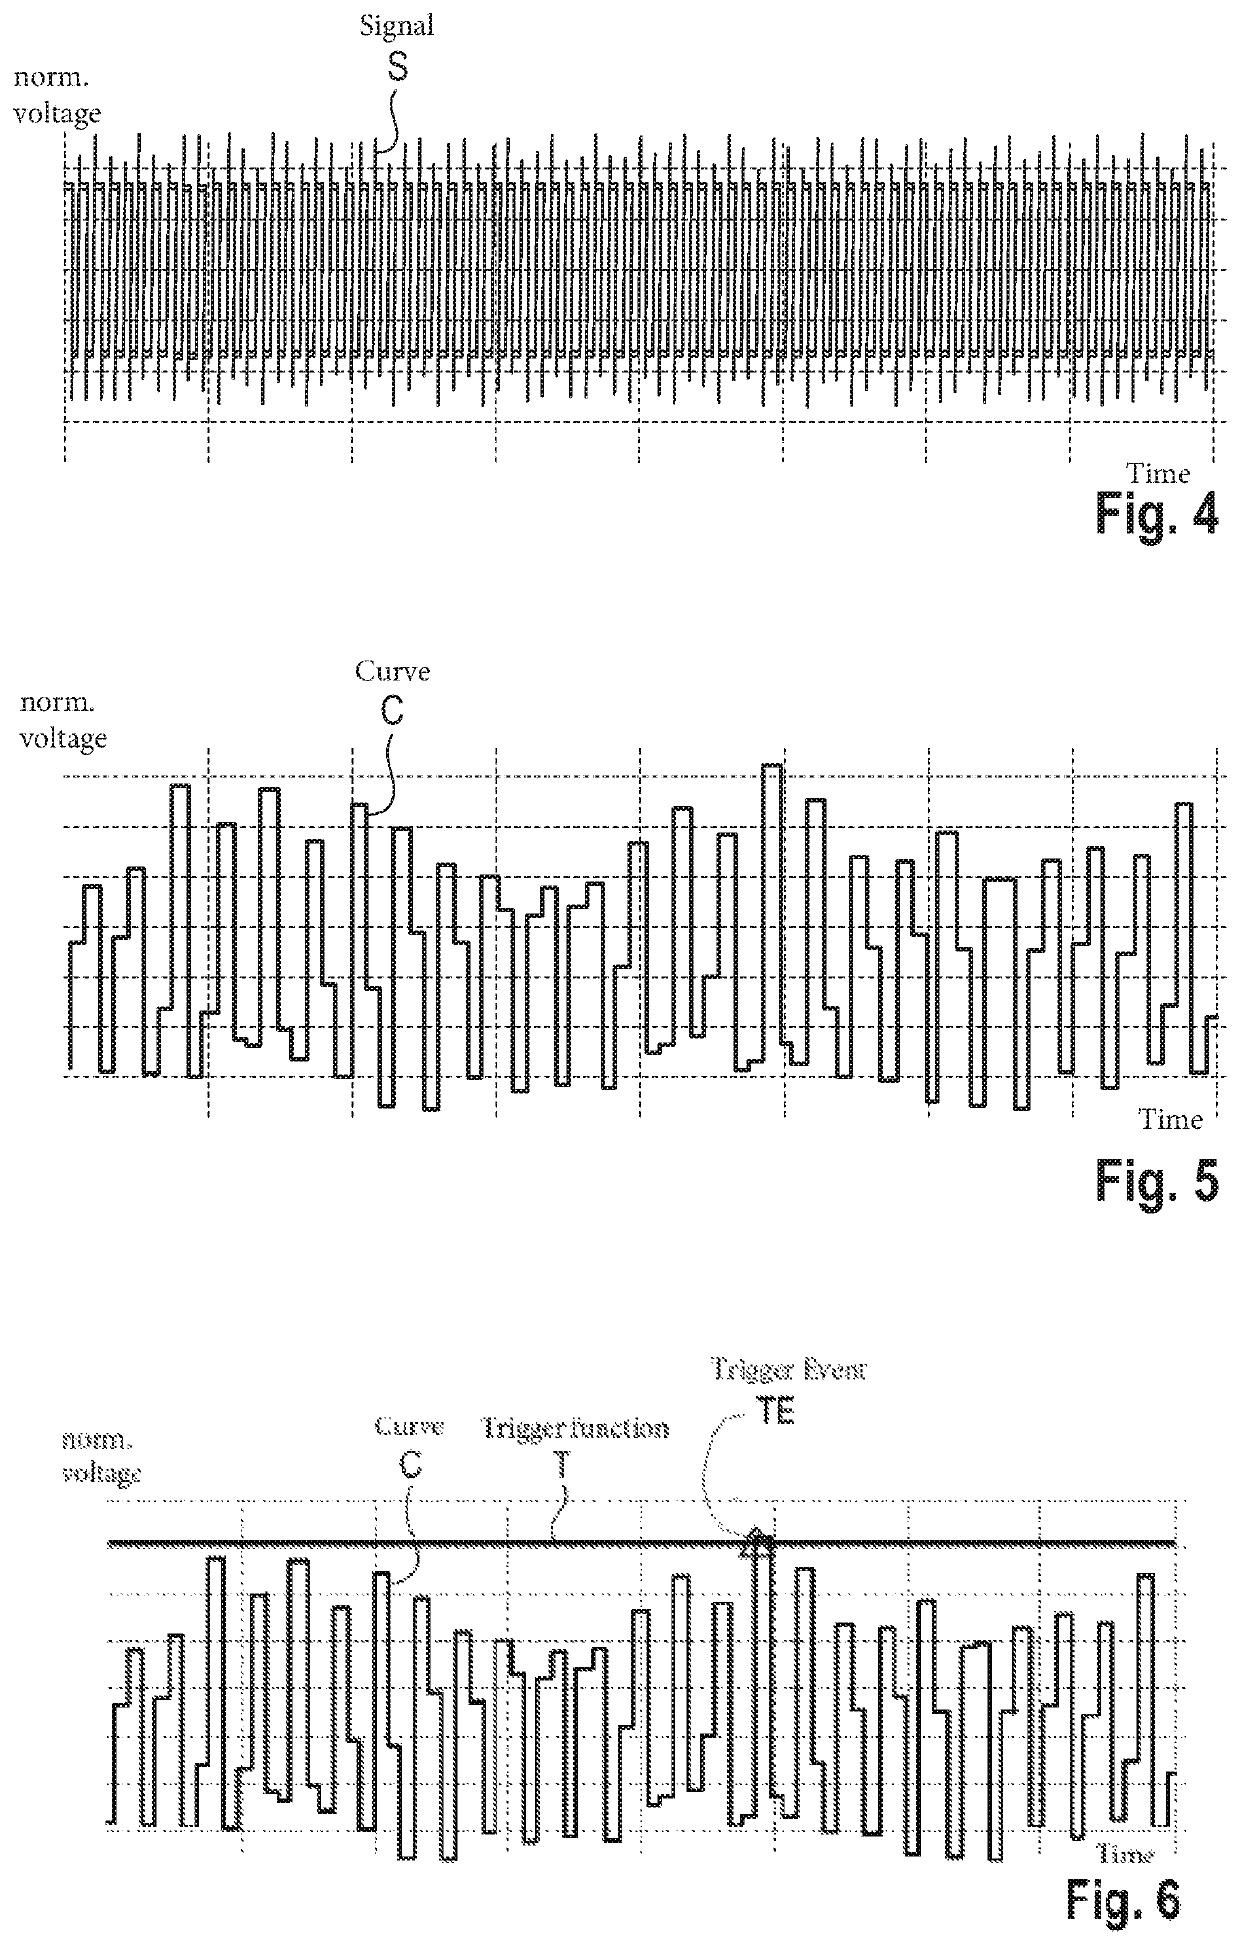
[0016]The invention is based on the finding that the analysis of the derived curve representing the measurement value(s) over time, also called track, is simplified by applying at least one trigger function on that track. Thus, a trigger event is generated provided that a special behavior and / or an anomaly occur(s) with respect to the track. The trigger event clearly indicates the position in the track on the display of the measurement and analyzing device. Thus, the user easily recognizes at which position of the track the special behavior and / or the anomaly occur(s). Hence, the user of the measurement and analyzing device does not have to analyze the track by visual inspection which simplifies and accelerates the analysis. Further, there is no more risk that the user misses a certain anomaly and / or special behavior since the trigger function applied generates a dedicated trigger event provided that the corresponding anomaly and / or special behavior occur(s). Generally, the track or rather the derived curve is a record of measurement values over the time.
[0020]Particularly, said trigger event is displayed on a display of said device. Thus, the user can easily recognize the position and eventually analyze any further effects which might relate to the anomaly and / or special behavior. Accordingly, the user might analyze the reason for the anomaly and / or special behavior.
[0023]According to another aspect, multiple trigger functions are applied simultaneously. Furthermore, different trigger functions can be applied on one and the same curve derived (track). Thus, a trigger event is generated when at least one of the several trigger functions is triggered by the curve derived. Moreover, different measurements on the signal to be analyzed can be conducted such that different tracks are obtained. These different derived curves (tracks) may be displayed in certain regions of the display. Thus, the user can analyze different aspects in a short time, in particular simultaneously, as the different tracks are displayed on the display simultaneously.
[0026]Particularly, said oscilloscope is a digital oscilloscope. Accordingly, several trigger functions may be used which cannot be applied when using an analog oscilloscope. Hence, the functionality of the oscilloscope is increased.
[0028]Furthermore, said device may be a handheld device. Thus, the user can use the device everywhere resulting in a high flexibility. The device may comprise a battery unit in order to ensure the required power supply.

Problems solved by technology

However, the user may miss an anomaly unintentionally.

Method used


Image

  • Method for analyzing a signal as well as measurement and analyzing device
  • Method for analyzing a signal as well as measurement and analyzing device
  • Method for analyzing a signal as well as measurement and analyzing device

Examples


Embodiment Construction

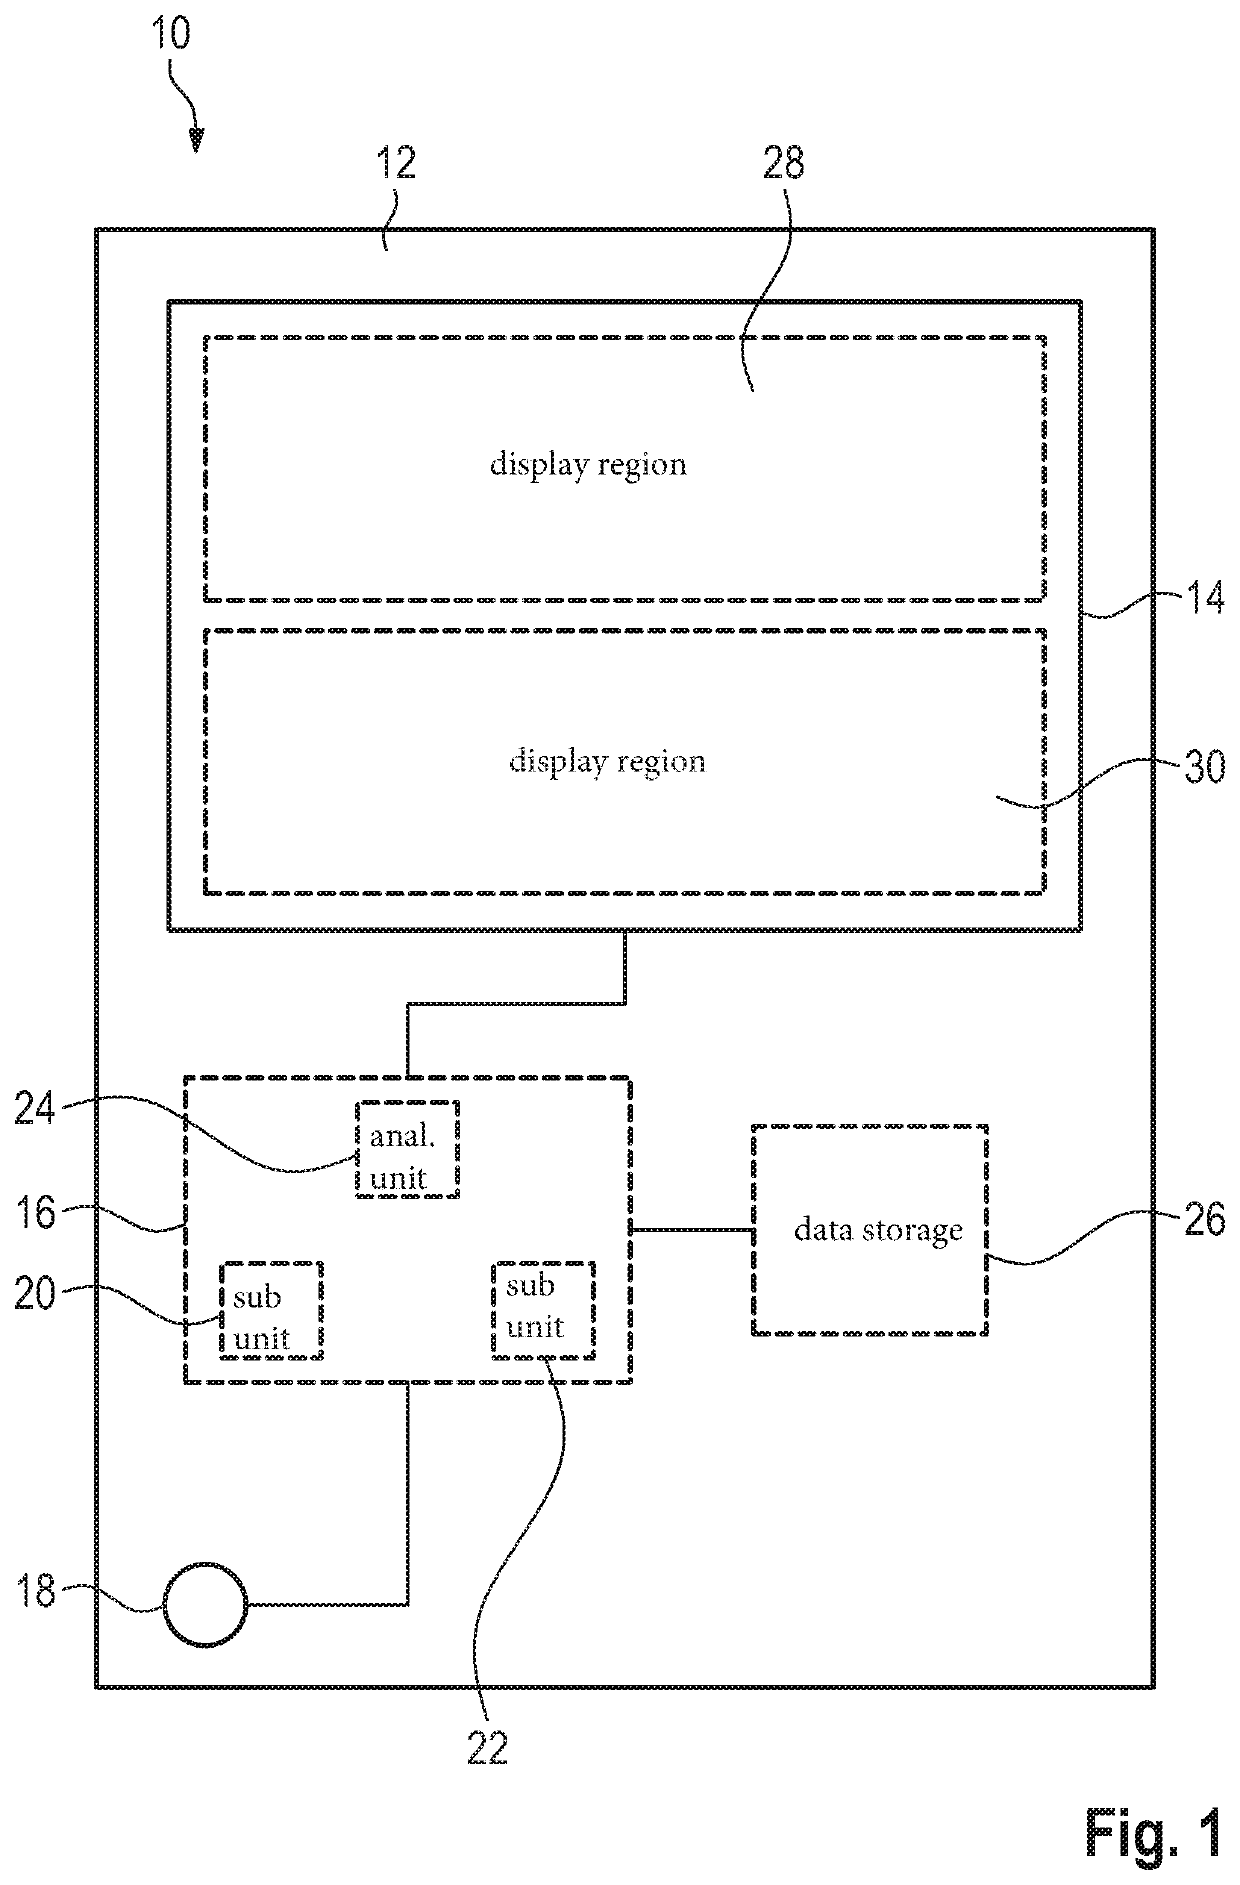
[0037]In FIG. 1, a measurement and analysis device 10 for analyzing at least one signal is schematically shown, in particular a handheld digital oscilloscope.

[0038]The measurement and analysis device 10 comprises a housing 12, a display 14, in particular a touch display, and a processing unit 16 being housed in the housing 12.

[0039]Further, an input 18 is provided for receiving the signal to be analyzed. The input 18 may be a coaxial port or any other suitable port for receiving a signal to be analyzed. The signal to be analyzed might be a signal originated from a certain source, for instance an electromagnetic signal from a radio frequency source such as a sine wave, or several decoded values, in particular serial decoded values, which represent the signal to be analyzed.

[0040]The signal received via the input 18 is internally forwarded to the processing unit 16 which is positioned between the input 18 and the display 14. Thus, the signal to be analyzed is processed by the processi...


PUM


Abstract

A method for analyzing at least one signal by using a measurement and analyzing device is described. At least one measurement on said signal to be analyzed is conducted in order to obtain at least one measurement value. A diagram comprising said at least one measurement value over the time is provided. A curve of said at least one measurement value over the time is derived from said diagram. At least one trigger function is applied to said derived curve such that a trigger event is generated in case said at least one trigger function is triggered by said derived curve. Further, a measurement and analyzing device is described.

Description

TECHNICAL FIELD[0001]The invention relates to a method for analyzing at least one signal by using a measurement and analyzing device and a measurement and analyzing device.BACKGROUND OF THE INVENTION[0002]Measurement and analyzing devices such as oscilloscopes are known in the state of the art in order to measure a time varying signal and visualize the signal as an acquired waveform on a display of the device. The acquired waveform may be visualized on an analog or a digital oscilloscope having a display wherein the analog and digital oscilloscopes have different characteristics, in particular regarding the trigger functions which may be applied to the acquired waveform.[0003]Generally, the oscilloscopes have at least one trigger function for capturing interesting parts of the acquired waveform for clear signal characterization since the trigger is the determining point in the acquired waveform. Thus, the trigger function makes a repetitive waveform look static. Thus, the different ...

Claims


Application Information

Patent Timeline
Patent Type & Authority Patents(United States)
IPC IPC(8): G01R13/02
CPCG01R13/0254
Inventor OHLEN, VOLKER
Owner ROHDE & SCHWARZ GMBH & CO KG
Learn More