
Process for forecasting product demand

a technology for forecasting product demand and product demand, applied in the field of forecasting product demand, can solve problems such as dramatic jump in demand, modules often cannot distinguish between good data and bad data, and distinct limitations

Inactive Publication Date: 2003-11-13
KLINGLER GREGORY L
View PDF5 Cites 52 Cited by
  • Summary
  • Abstract
  • Description
  • Claims
  • Application Information

AI Technical Summary

Problems solved by technology

Along with the many advantages present in the demand forecast modules of today's inventory management and production planning systems, comes some distinct limitations.
These modules often cannot distinguish between good data and bad data.
That large order from a customer would result in a dramatic jump in demand for the company under consideration.
Not only do these systems typically contain no information regarding the events associated with demands of the past, they have no information regarding the future.
That future event will likely lead to increased sales demand from the company under consideration, yet the normal demand forecast module would not know of that future event.
The shear quantity of output often tends to overwhelm the operator.
As a consequence, the systems are often allowed to run unsupervised resulting in sub-optimal inventory levels.

Method used


Image

  • Process for forecasting product demand
  • Process for forecasting product demand
  • Process for forecasting product demand

Examples


Embodiment Construction

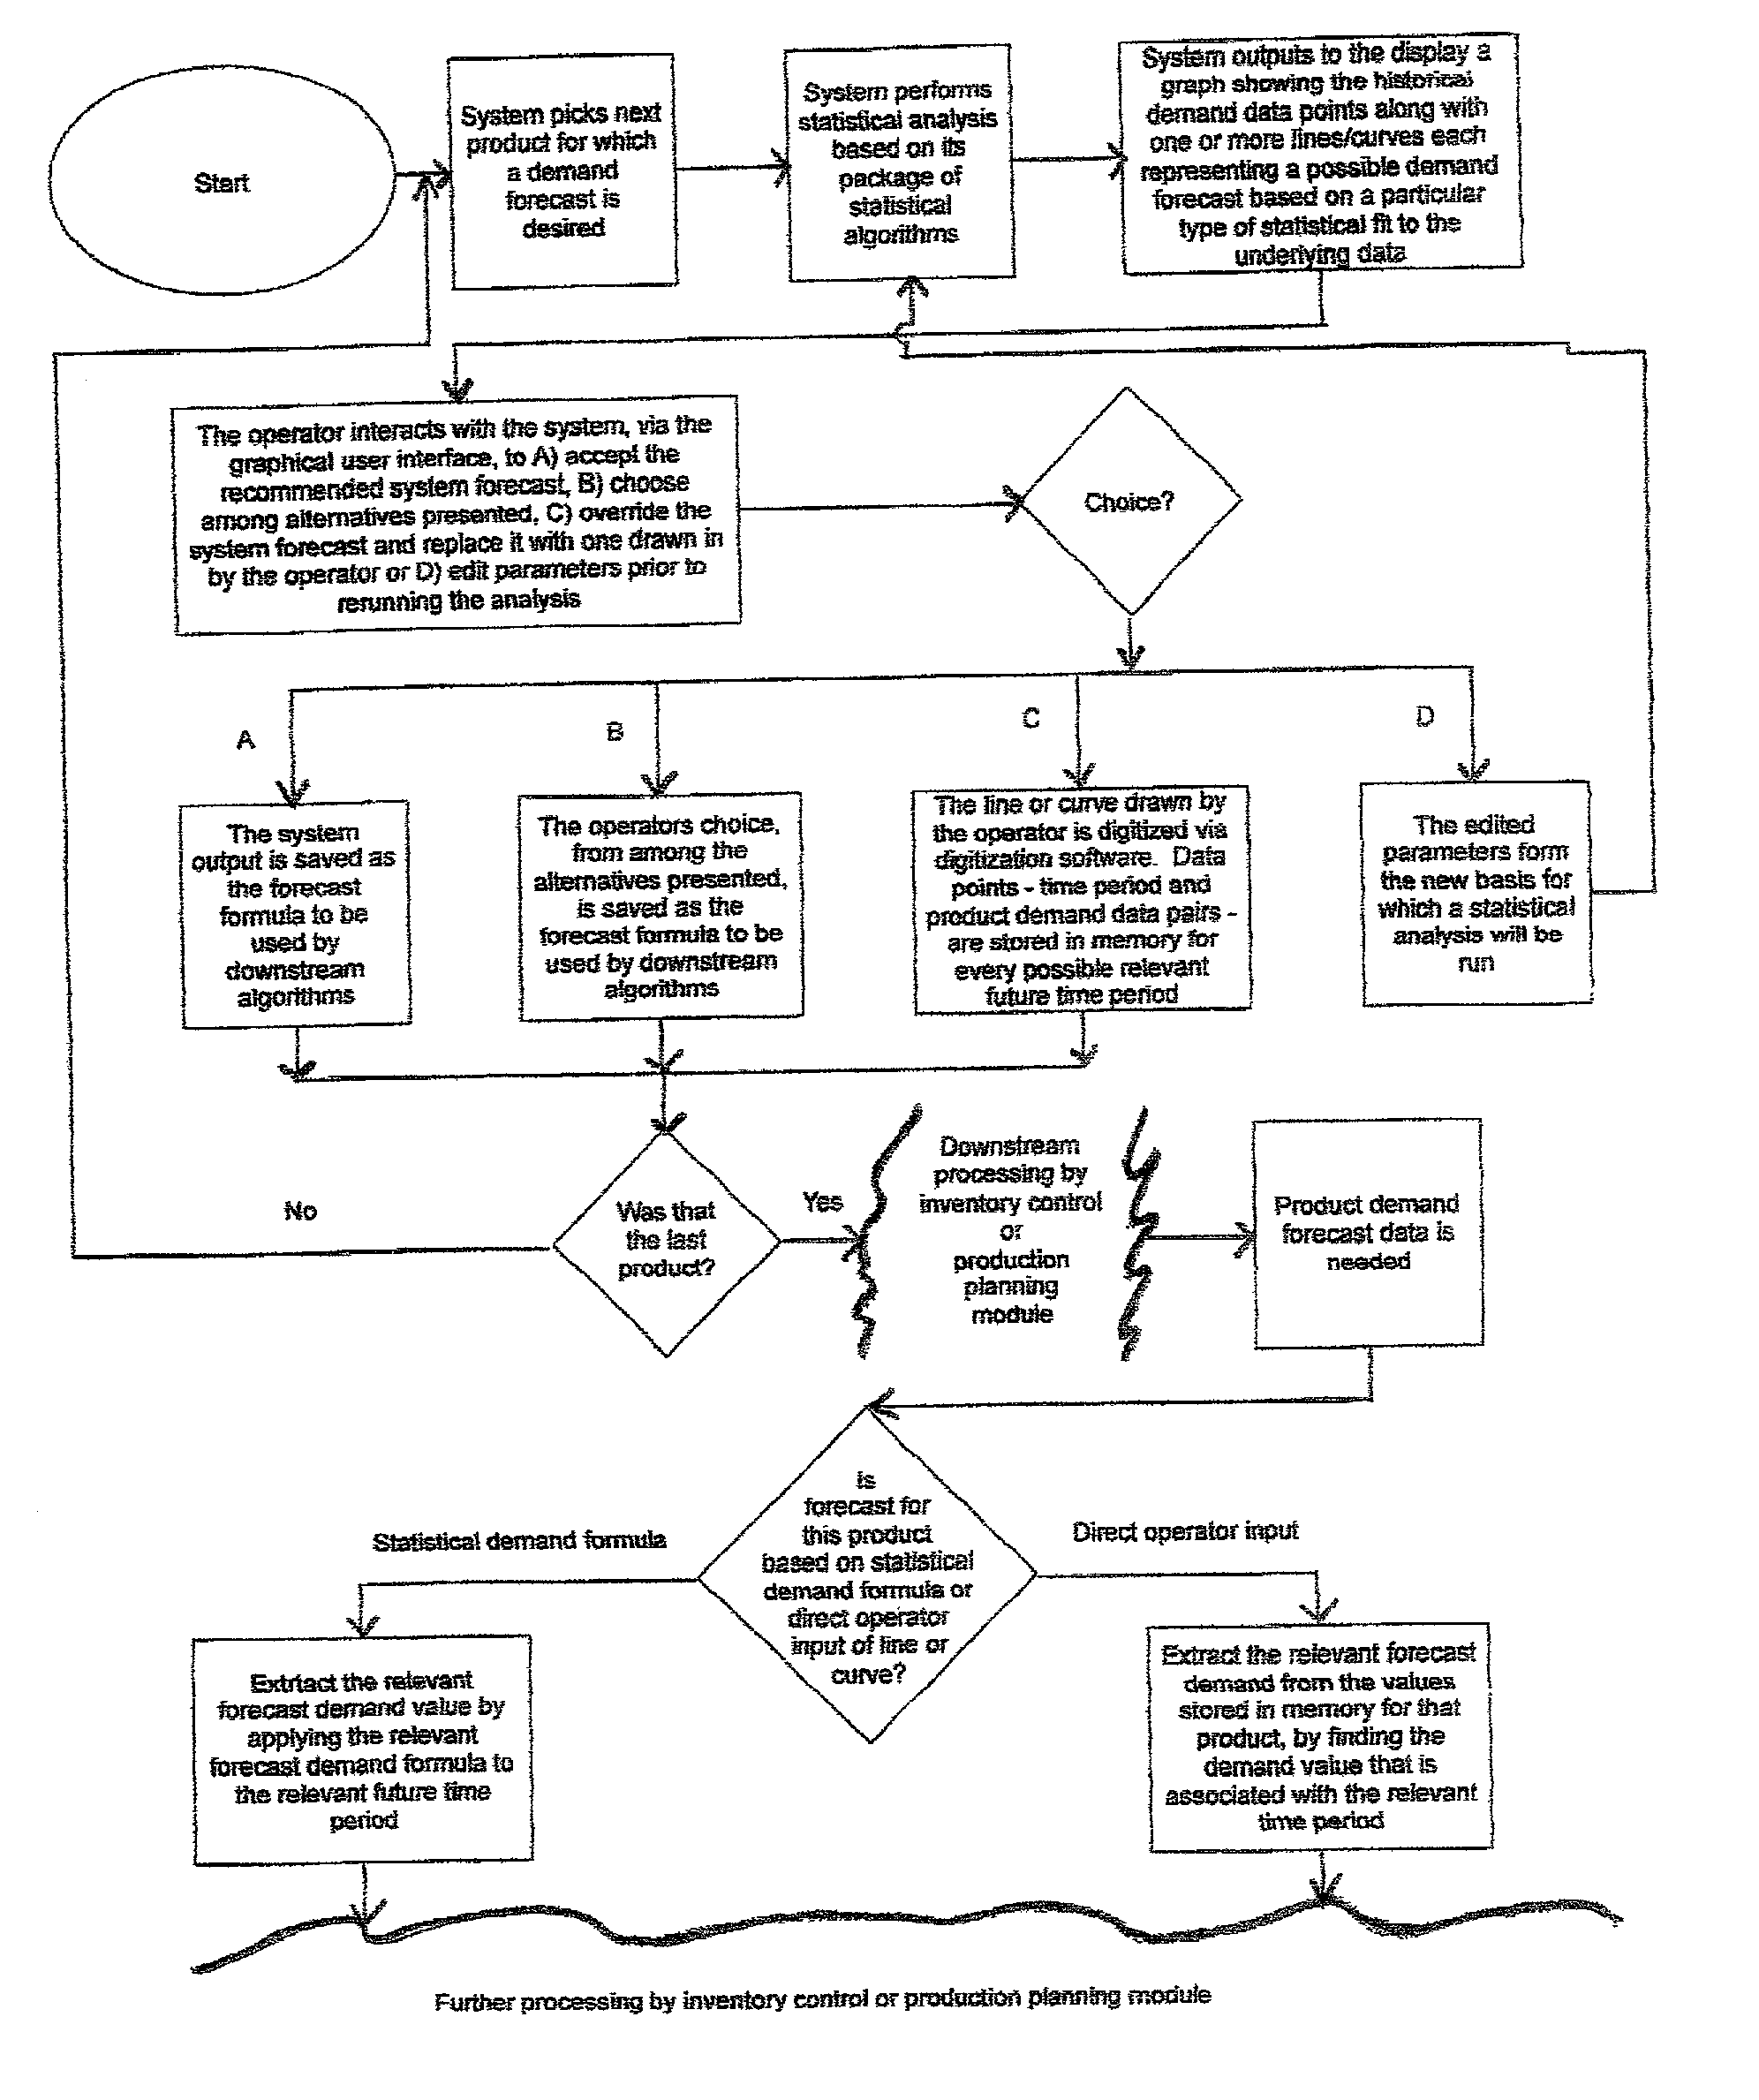
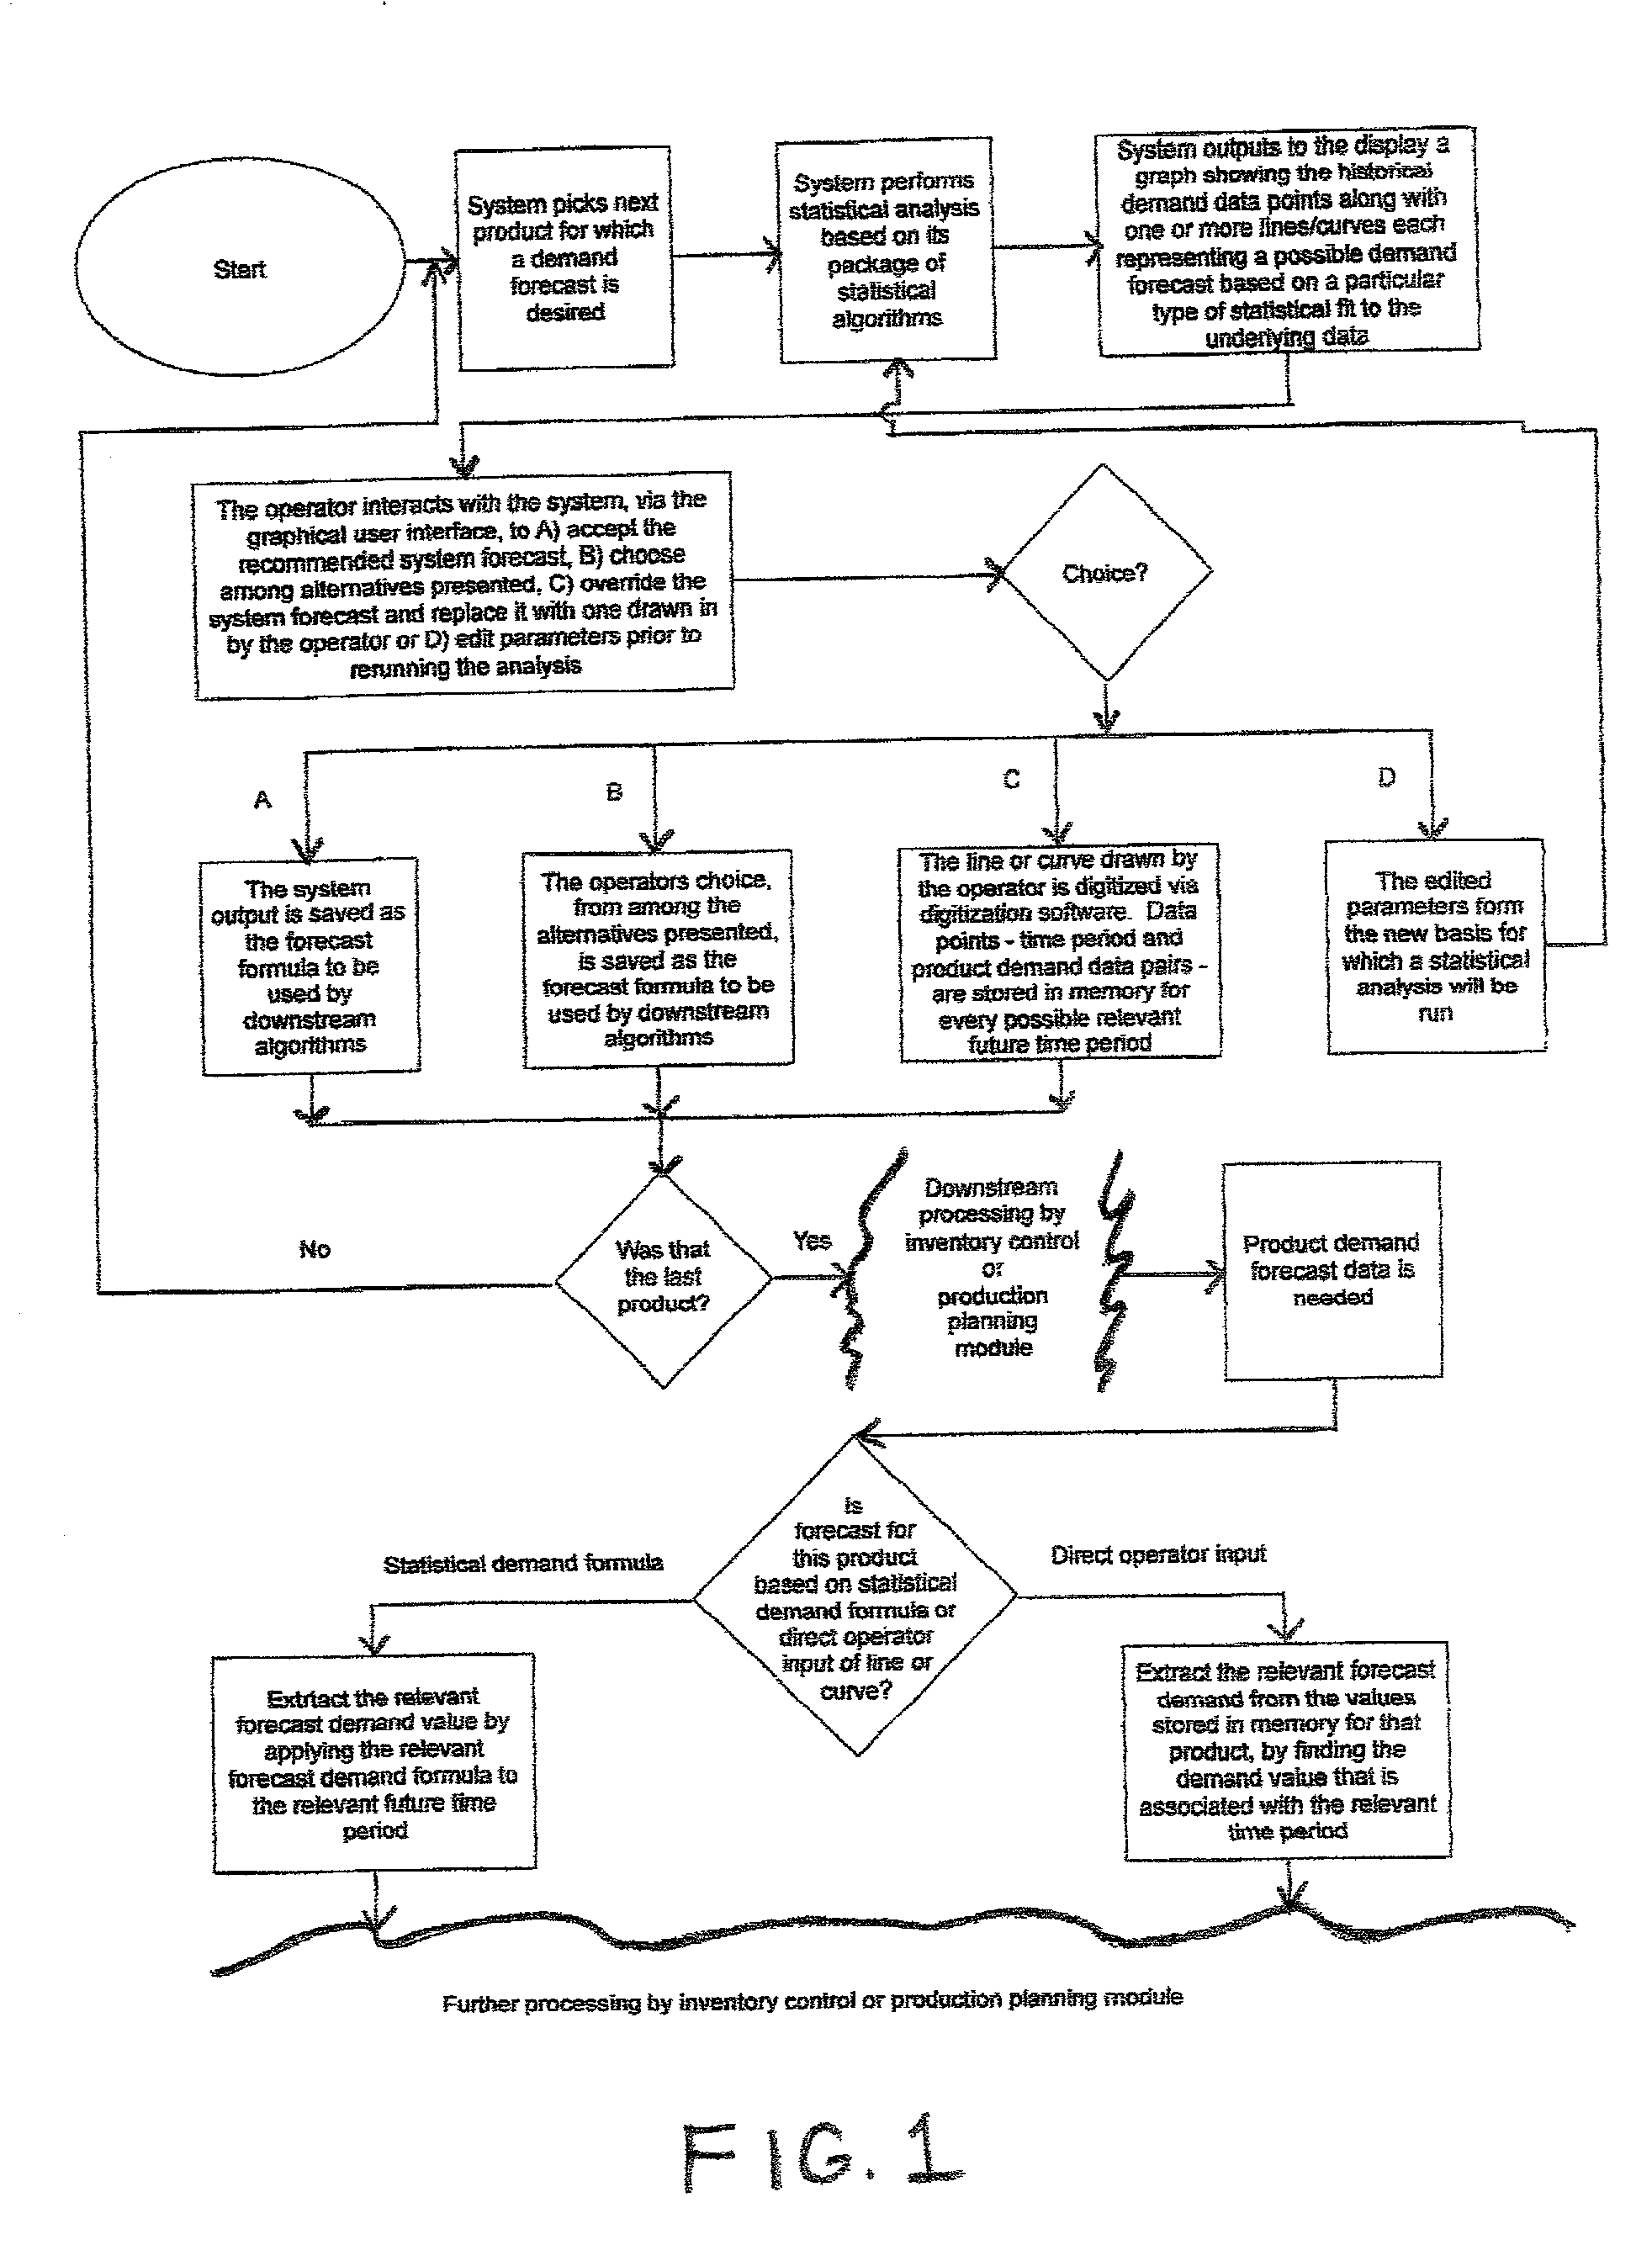
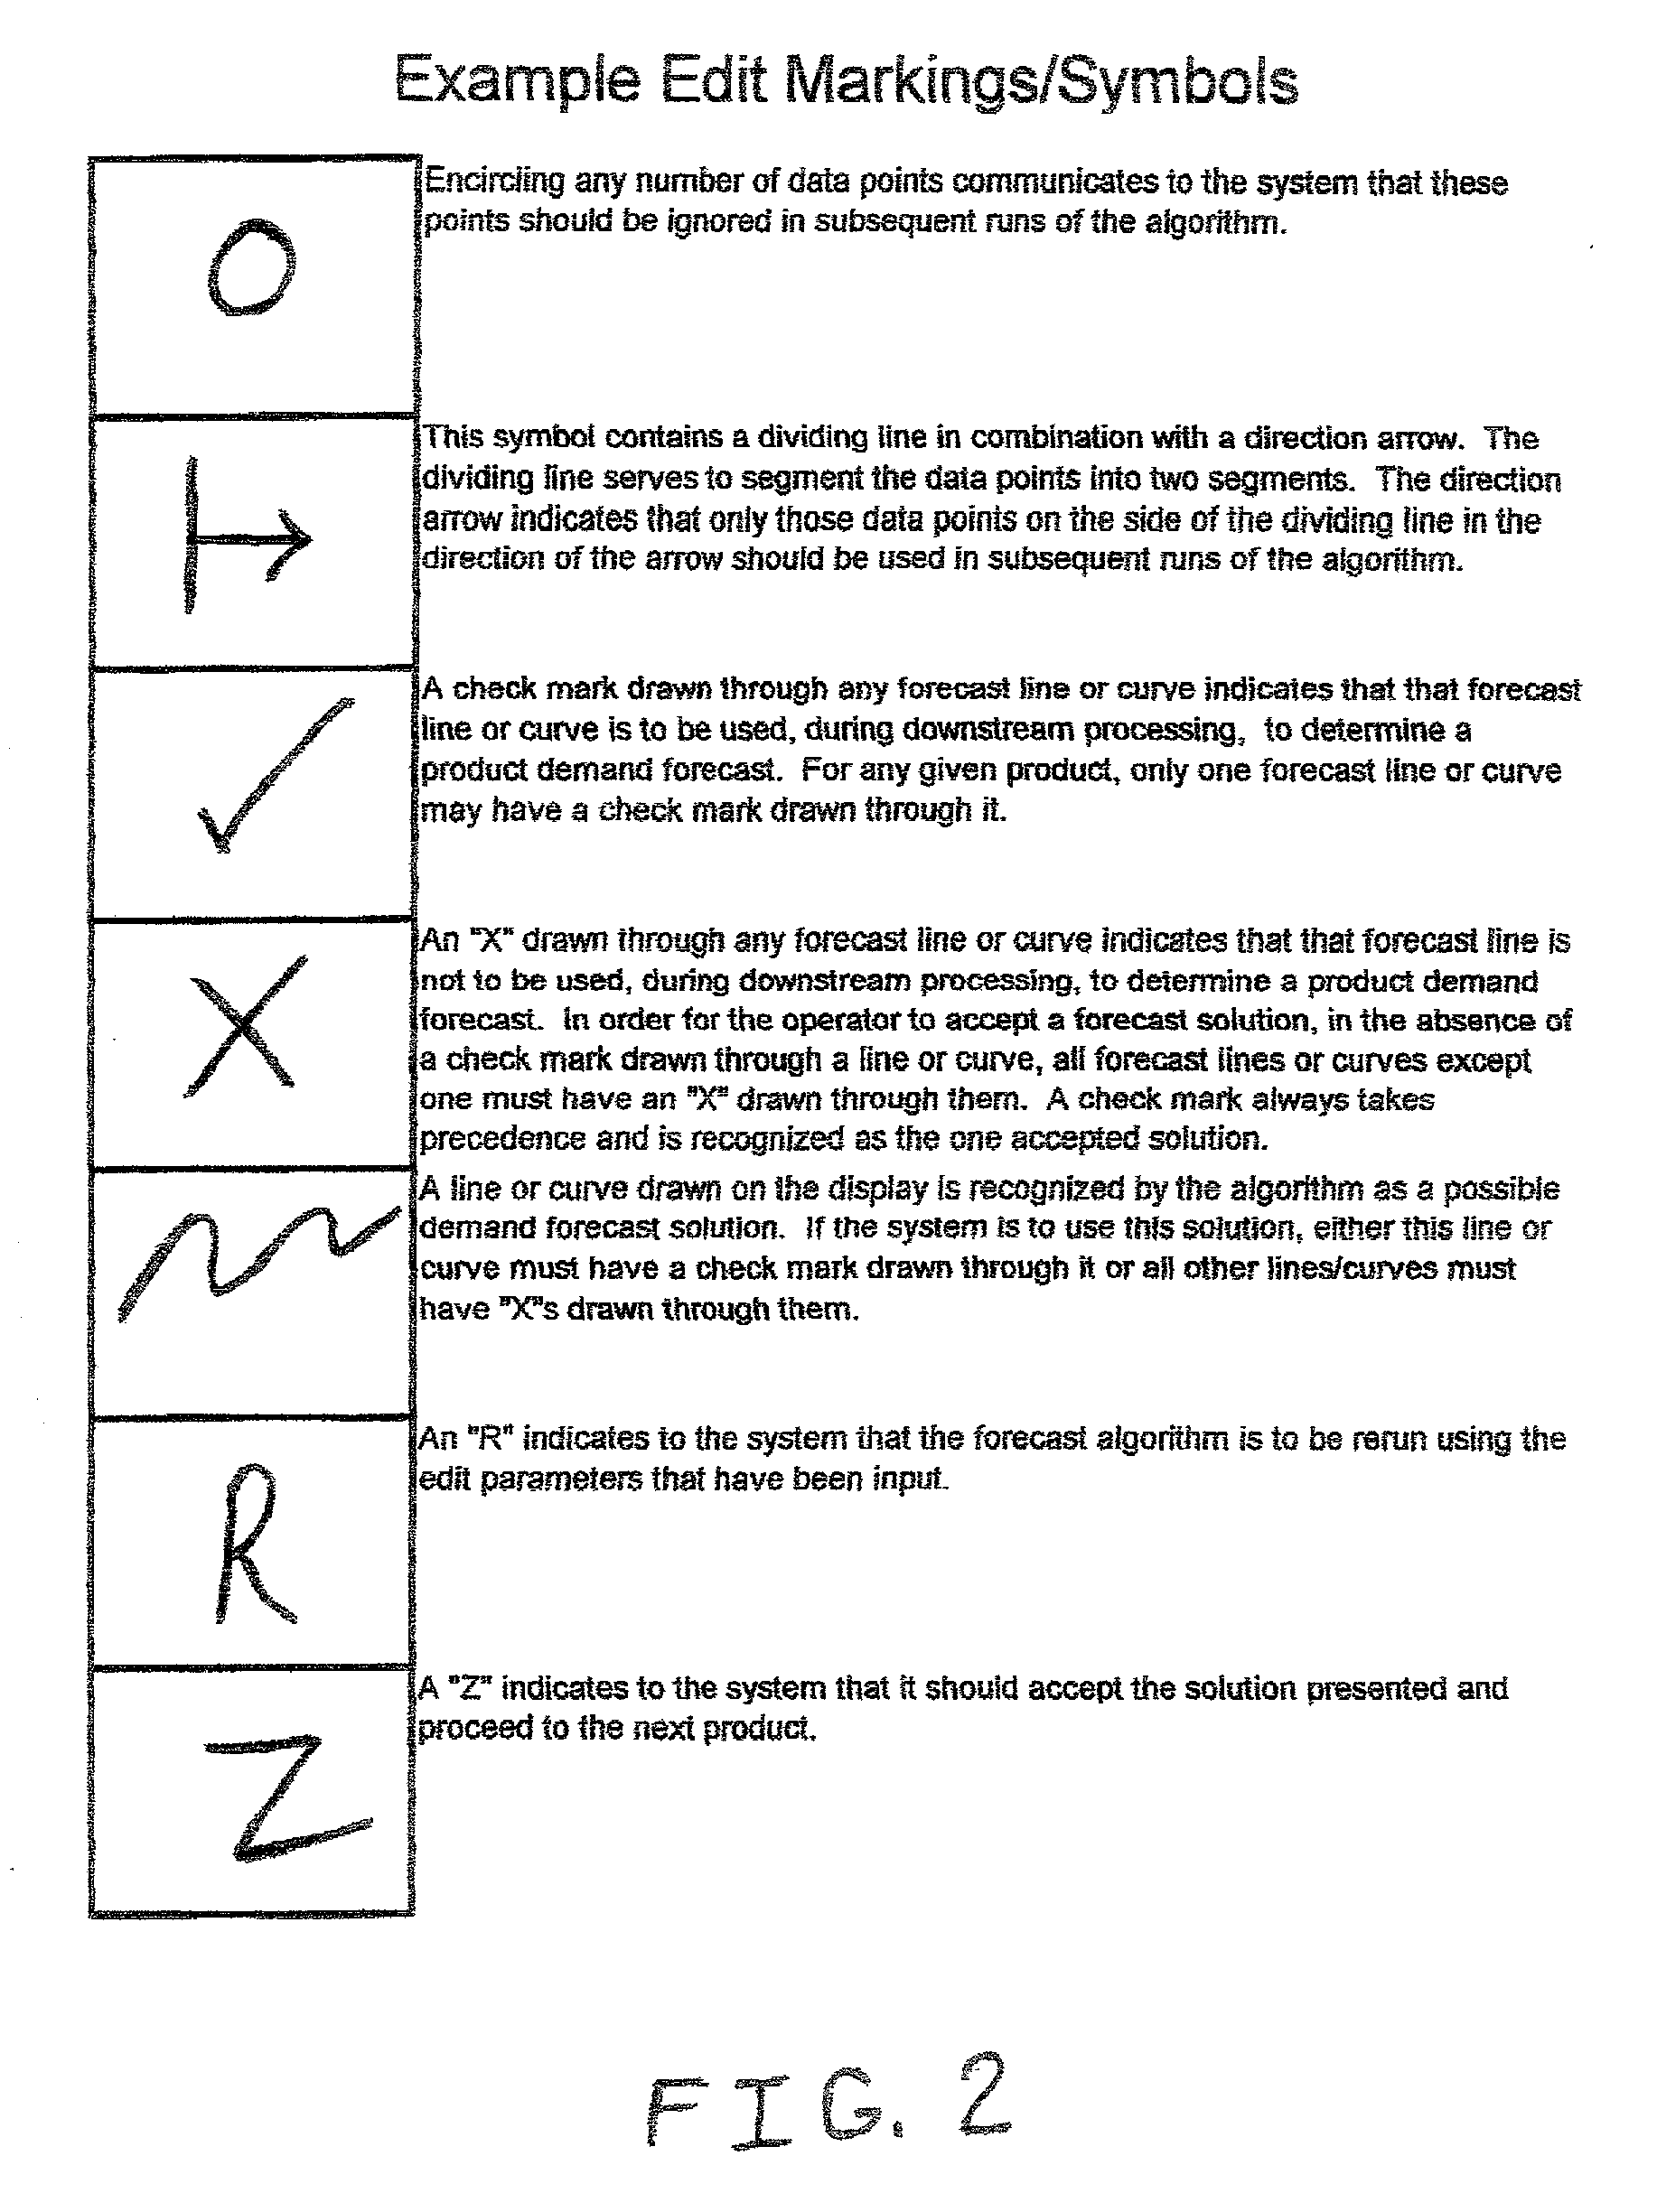
[0043] FIG. 1 is a flowchart of the improved process of this invention, the steps of which are explained fully within this flowchart. FIG. 2 is an example, for illustrative purposes, of the types of edit marks that might be used in this system. Any collection of symbols would work as long as each such symbol is tied to one and only one action as coded in the accompanying software algorithm. The improved process of this invention draws upon a combination of technologies not previously applied to the demand forecast portion of inventory control and / or production planning modules. It also includes operator interaction with the automated data processing system in a way which derives the greatest benefit from each, human and computer.

[0044] The technologies which are integrated in this improved process are not new, are generally widely available, and therefore will not be explained in detail herein. The innovation in this invention includes the combination of these technologies in a mann...


PUM


Abstract

An improved process for forecasting product demand to be used within inventory management and / or production planning systems. This improved process overcomes the limitations of the prior art by providing an optimal combination of automated statistical data processing and human intelligence, in one interactive system. The new method provides an efficient means for an operator to incorporate much information, known to the operator, that would otherwise be missed by the systems of the prior art. It allows the operator to analyze information very quickly by viewing graphs drawn on a graphical user interface and to make changes very quickly using that same graphical user interface. The method relies on the use of edit markings / symbols drawn on the display portion of the graphical user interface. These edit markings / symbols are used to make changes to the parameters forming the basis for a product demand forecast. The markings / symbols are recognized by the forecast software algorithm and a new forecast is generated based on the revised parameters.

Description

[0001] Not applicable.STATEMENT REGARDING FEDERALLY SPONSORED RESEARCH AND DEVELOPMENT[0002] Not applicable.[0003] 1. Field of Invention[0004] This invention relates to a process for establishing product demand forecasts and, more specifically, to an improvement in the demand forecast process used by inventory control and production planning software modules.[0005] 2. Description of Prior Art[0006] For most manufacturing and / or distribution businesses, the investment in inventory is among the largest financial investments within the business. Additionally many businesses, such as grocery stores, have inventory that is perishable and must be used within a limited timeframe. It is therefore essential that the financial investment in inventory be held to a level as low as possible while still providing the product required to meet customer demands. For many products, business competition is intense such that suppliers need to be able to provide customers with product shortly after the ...

Claims


Application Information

Patent Timeline
IPC IPC(8): G06Q10/08G06Q30/02
CPCG06Q30/0202G06Q10/087
Inventor KLINGLER, GREGORY L.
Owner KLINGLER GREGORY L
Learn More