Methods and structure for improved interactive statistical analysis

Active Publication Date: 2005-01-27
SWISS REINSURANCE CO LTD
View PDF16 Cites 28 Cited by
  • Summary
  • Abstract
  • Description
  • Claims
  • Application Information

AI Technical Summary

Benefits of technology

The present invention advances the state of the useful arts by providing methods and associated structure for an improved user interface for statistical analysis of data. More specifically, features and aspects hereof provide methods and associated

Problems solved by technology

Current techniques and systems used for such statistical analysis are time-consuming and cumbersome to use.
Though a number of automated tools can assist a user in such analysis, present techniques and systems remain heavily reliant on manual aspects of the process.
Such manual processes induce numerous errors due to frequent manipulation of the data through human processes.
Often, therefore, the analysis is incomplete as user shortcuts may eliminate relevant data from the statistical analysis process.
As noted above, these graphical analysis techniques often require significant human interaction to manipulate the data into an appropriate format for the desired graph or plot.
In addition, the visual inspection of data becomes cumbersome where a significant num

Method used


Image

  • Methods and structure for improved interactive statistical analysis
  • Methods and structure for improved interactive statistical analysis
  • Methods and structure for improved interactive statistical analysis

Examples


Example

DETAILED DESCRIPTION OF THE DRAWINGS

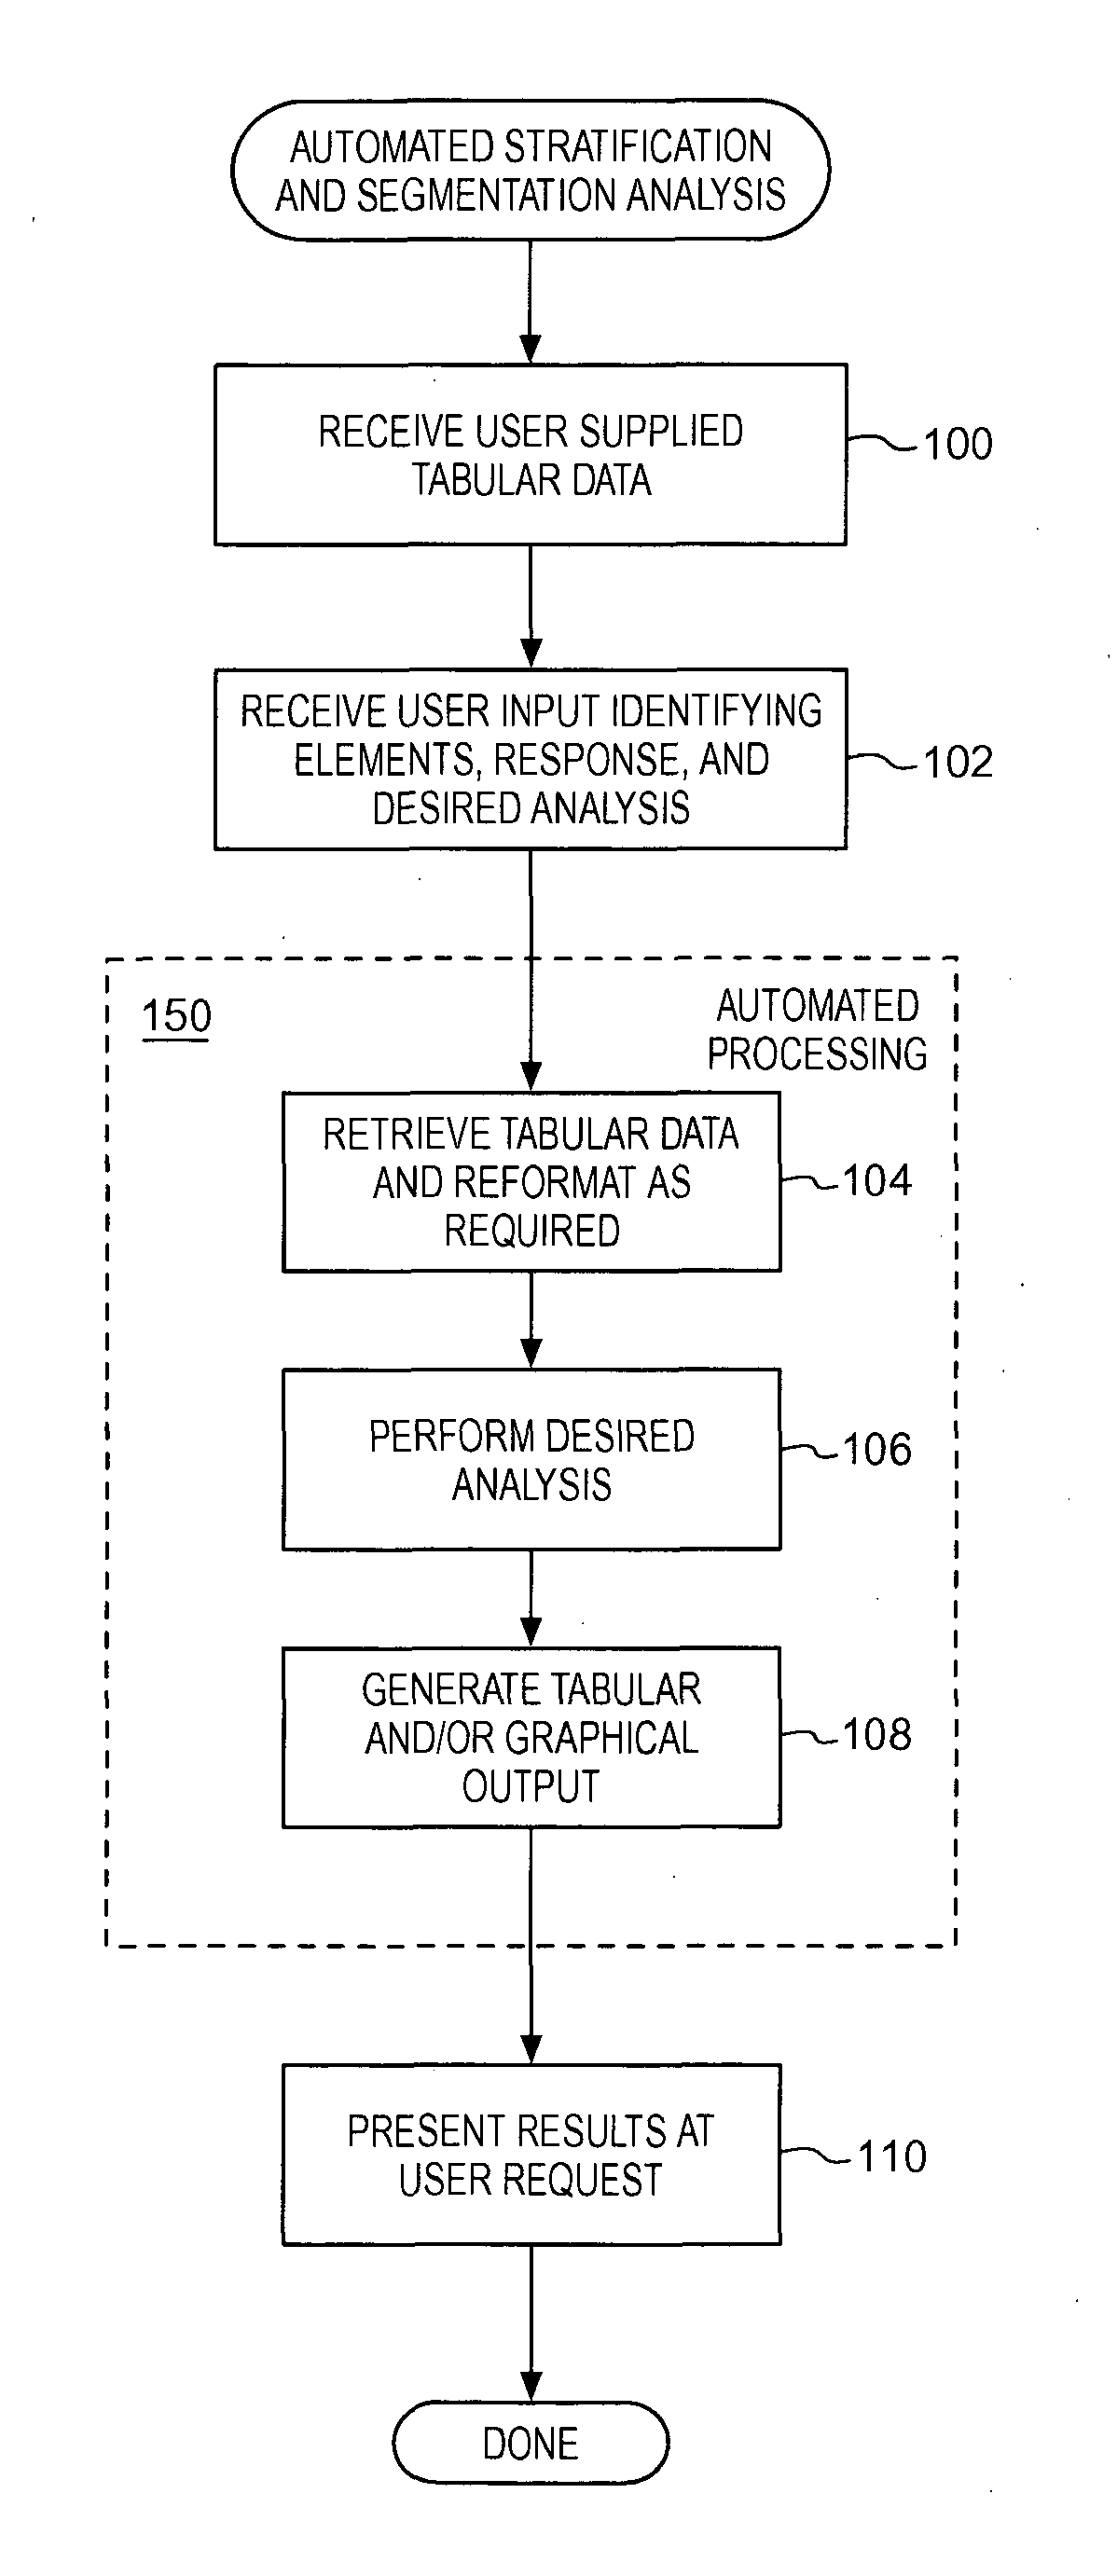
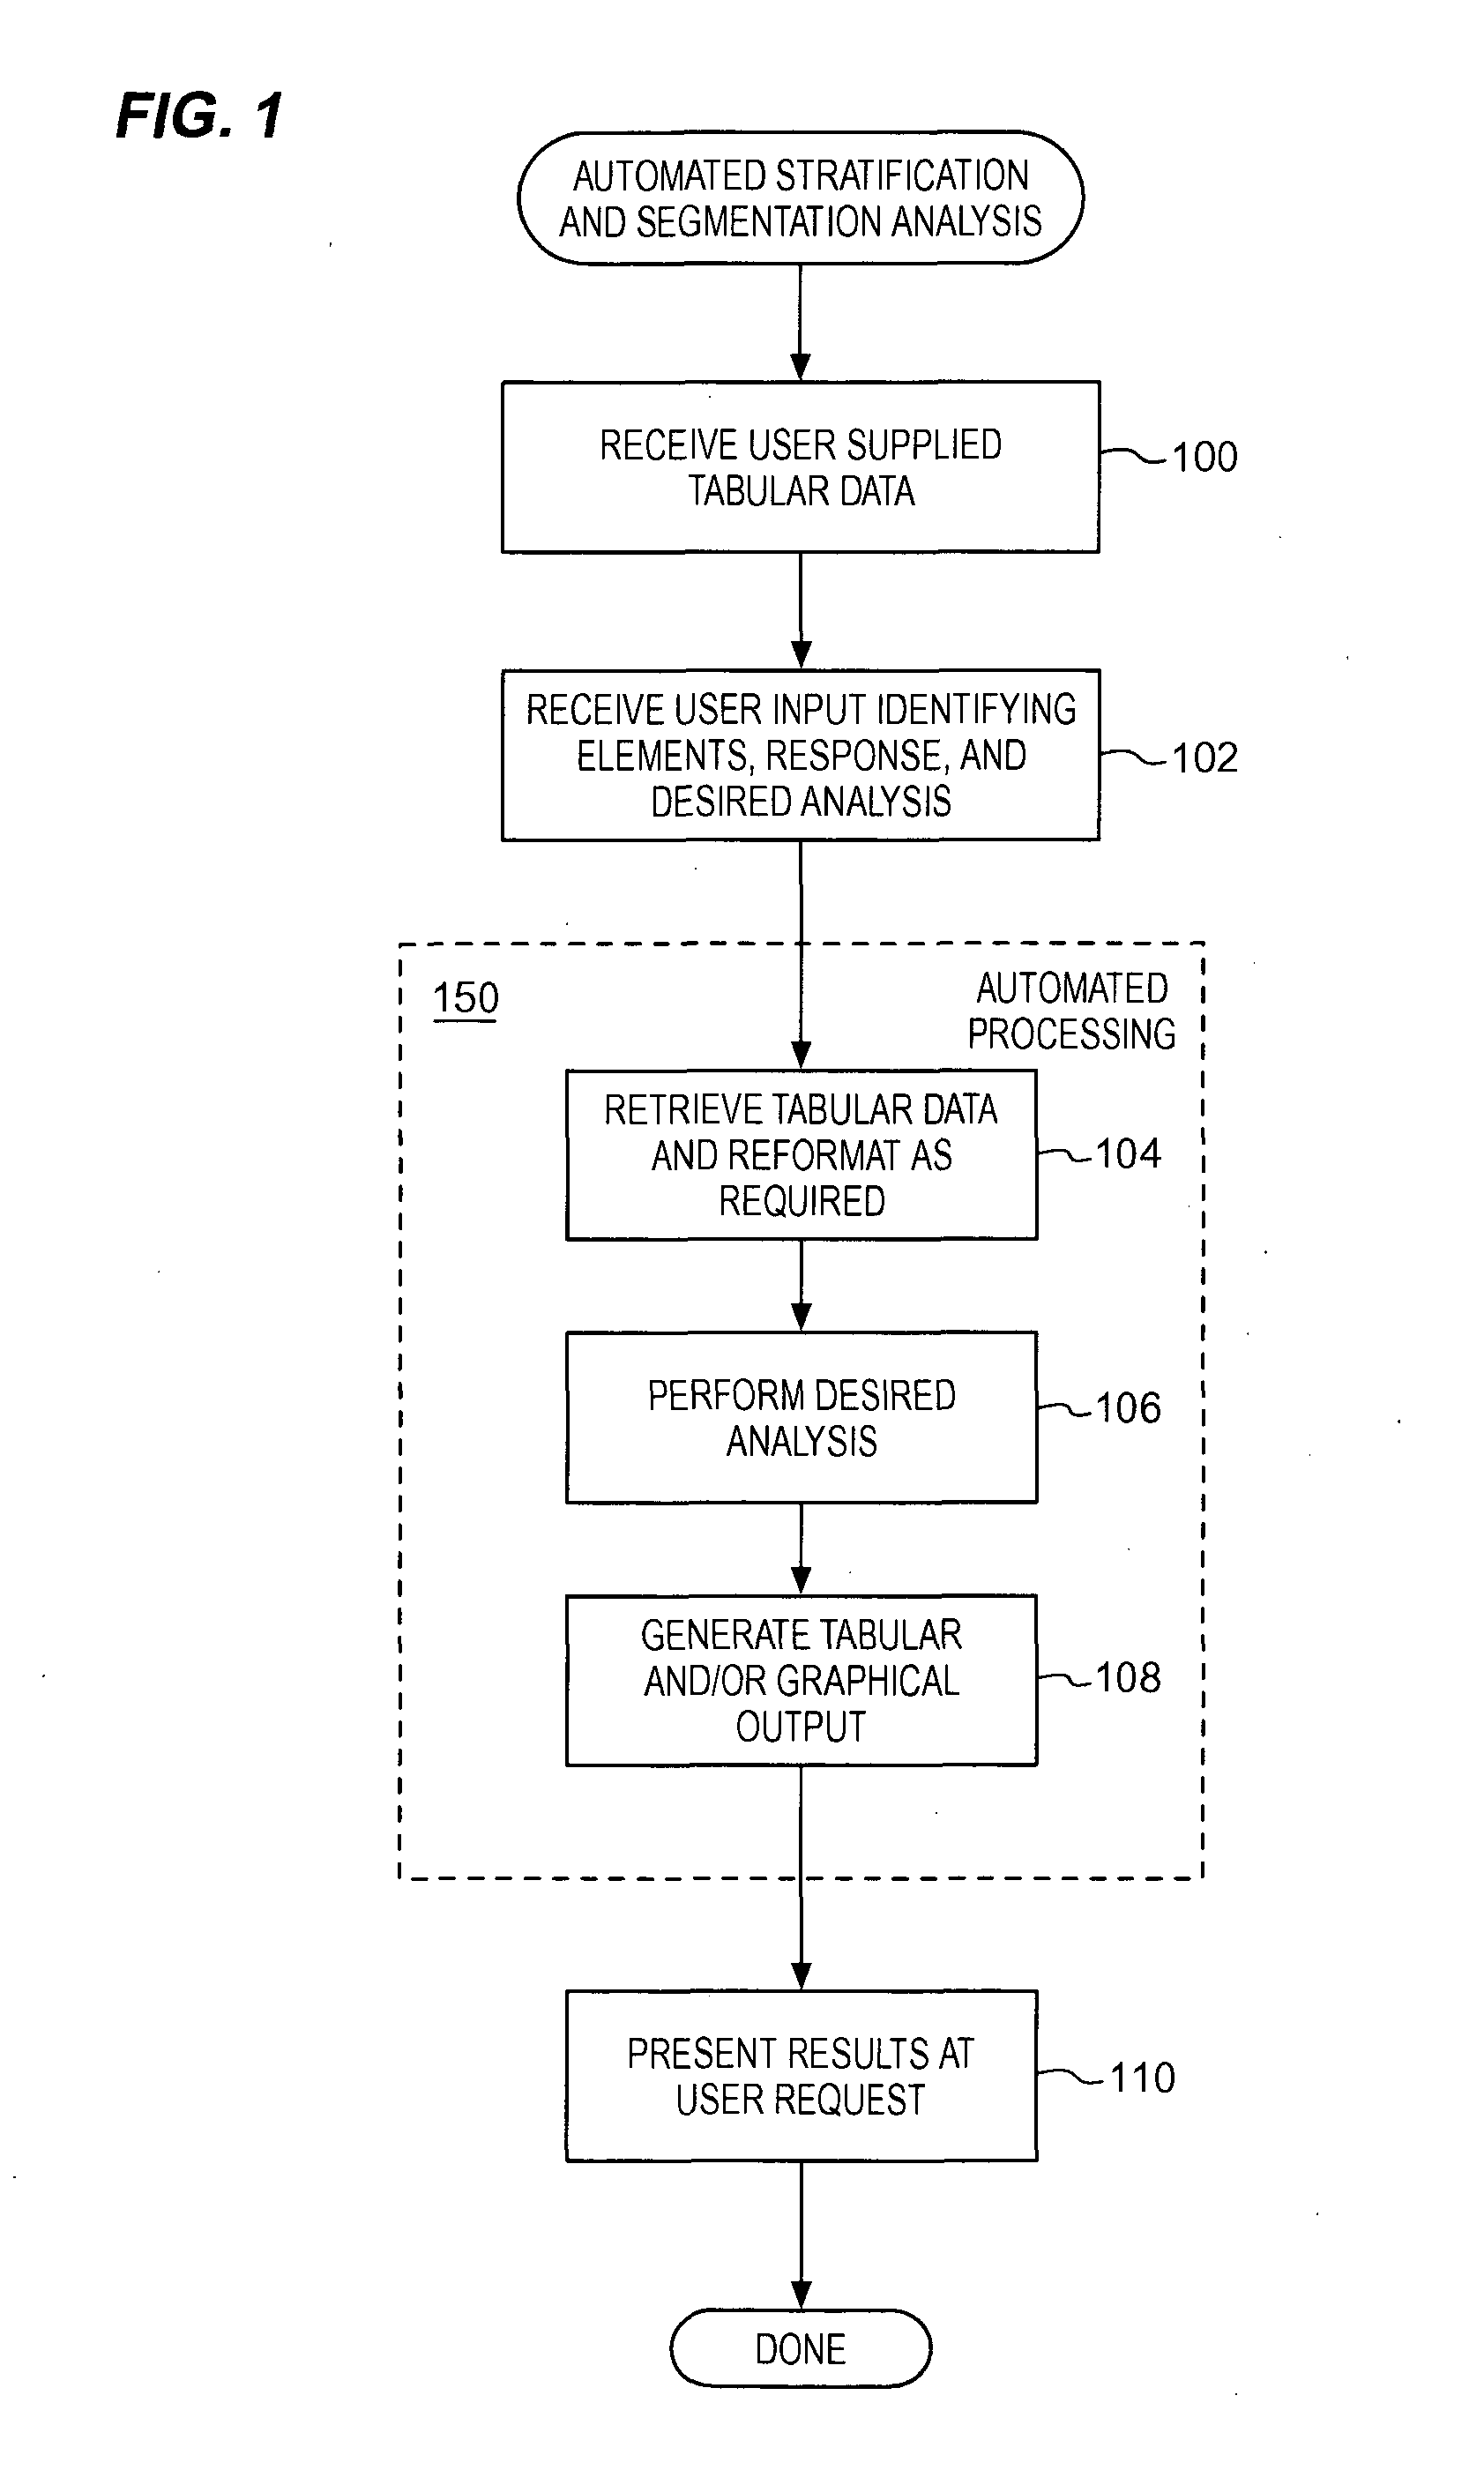
FIG. 1 is a flowchart describing processing of a method to provide improved, automated statistical analysis including data segmentation and data stratification. Overall, the method provides for receiving user supplied data in a simple, tabular format and receiving indications from a user as to the type of analysis to be performed. Statistical analysis then proceeds in a substantially automated fashion such that the statistical analysis is largely devoid of need for further user interaction. Results of the requested statistical analysis may be formatted for presentation to the user in tabular form and / or graphical form.

Element 100 of FIG. 1 is operable to receive user supplied data in a simple tabular form. In one embodiment, a user enters data into a data input page or worksheet of a standard spreadsheet program such as Microsoft Excel. Alternative approaches may obtain such tabular data from other automated sources including, for example, exis...


PUM


Abstract

Methods and associated structure for flexible, easy-to-use, robust, statistical analysis of one or more factors associated with a continuous response outcome. A simple user interface provides a wide variety of statistical analysis derived from user provided data. The user provides data in a simple tabular format after which no further human intervention is required to manipulate the data. Data is automatically manipulated and transformed as required to perform the desired, selected statistical analysis. Reduction of human interaction in manipulating data to perform desired statistical analysis improves statistical analysis processes by reducing human errors introduced in three data manipulation and encouraging users to perform or thorough analysis because time-saving shortcuts are no longer required.

Description

BACKGROUND In a number of business and scientific environments, statistical information is gathered and analyzed to identify or otherwise extract useful information from often voluminous collections of data. One common application of statistical analysis is to study processes or systems to identify the impact of different categorical (non-continuous) factors on a continuous response outcome. For example, it may be useful to study the impact different variables have on a typical commercial measure, such as average time in line for customers of a fast food restaurant. Some of the categorical factors generally expected to effect this exemplary outcome (time in line) may include: menu type, number of checkout registers, number of order takers, number of cooks, number of on-duty managers, presence of a drive-through feature in the restaurant, presence of a playground for entertaining children, location of the restaurant, etc. The results of such statistical analysis help show an analys...

Claims


Application Information

Patent Timeline
IPC IPC(8): G06F17/18
CPCG06F17/18
Inventor KUNCE, JIM D.
Owner SWISS REINSURANCE CO LTD
Why Eureka
Try Eureka