Measuring instantaneous signal dependent nonlinear distortion in response to varying frequency sinusoidal test signals

a nonlinear distortion and instantaneous signal technology, applied in the field of signal distortion measurement, can solve the problems of uncorrelated signal fidelity information, interference with prior methods for measuring burst frequencies, and devices that introduce errors such as noise and frequency aliasing,

Inactive Publication Date: 2005-10-20
TEKTRONIX INC
View PDF54 Cites 20 Cited by
  • Summary
  • Abstract
  • Description
  • Claims
  • Application Information

AI Technical Summary

Problems solved by technology

Further confusion in uncorrelated signal fidelity information is due to the fact that sinusoidal signal amplitudes may measure smaller or even larger than the envelope of the signal would indicate on a waveform display due to this otherwise unmeasured distortion.
These devices also introduce errors such as noise and frequency aliasing.
These errors and digital compression artifacts interfere with prior methods for measuring burst frequencies.
The methods as applied to video have been limited to measuring the consistency of ramp slope or step size of corresponding test signals.
These methods do not address distortions in sinusoids and for many processes, such as MPEG (Motion Picture Experts Group) compression, the nonlinearities of ramps and steps do not indicate the nonlinearities of sinusoids.
Also in the method of measuring out-of-band energy, the swept sinusoidal test signal presents a problem in that it contains a wide spectrum of energy.
Even if this is time-windowed prior to applying any of this rms out-of-narrowband distortion class of methods, generally noise and signal dependent distortions are not delineated as desired.
Combining a noise measurement with the out-of-band energy measurement, in order to delineate noise from distortion as a function of the test signal, is problematic for acceptable accuracy levels due to the variance of the noise measurement over a short time interval.

Method used


Image

  • Measuring instantaneous signal dependent nonlinear distortion in response to varying frequency sinusoidal test signals
  • Measuring instantaneous signal dependent nonlinear distortion in response to varying frequency sinusoidal test signals
  • Measuring instantaneous signal dependent nonlinear distortion in response to varying frequency sinusoidal test signals

Examples


Embodiment Construction

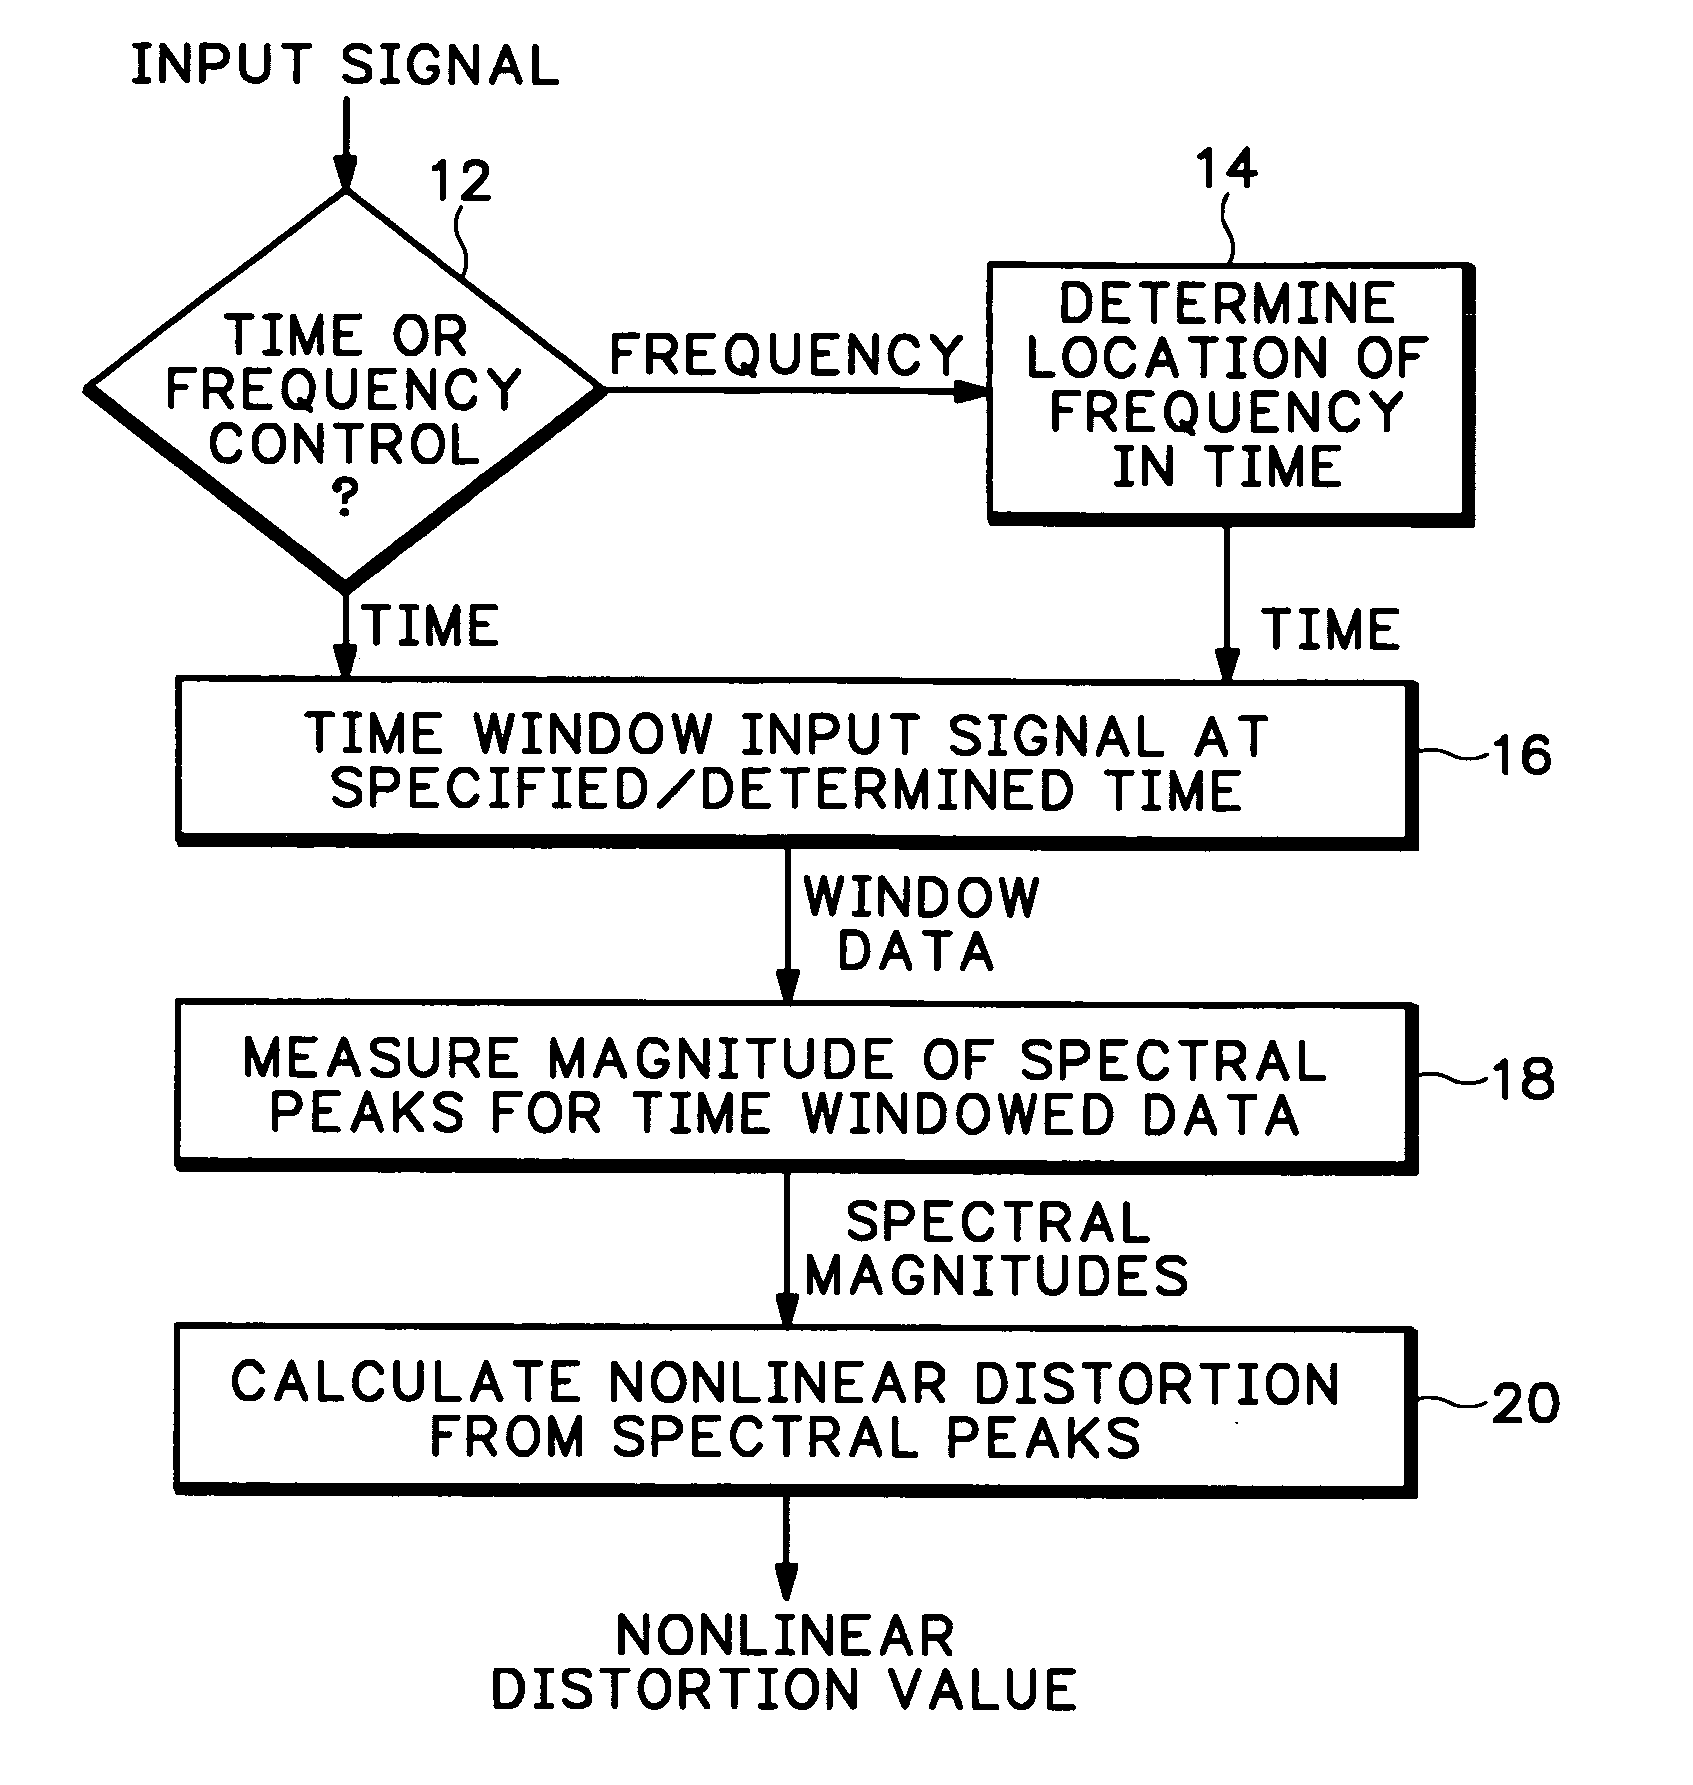
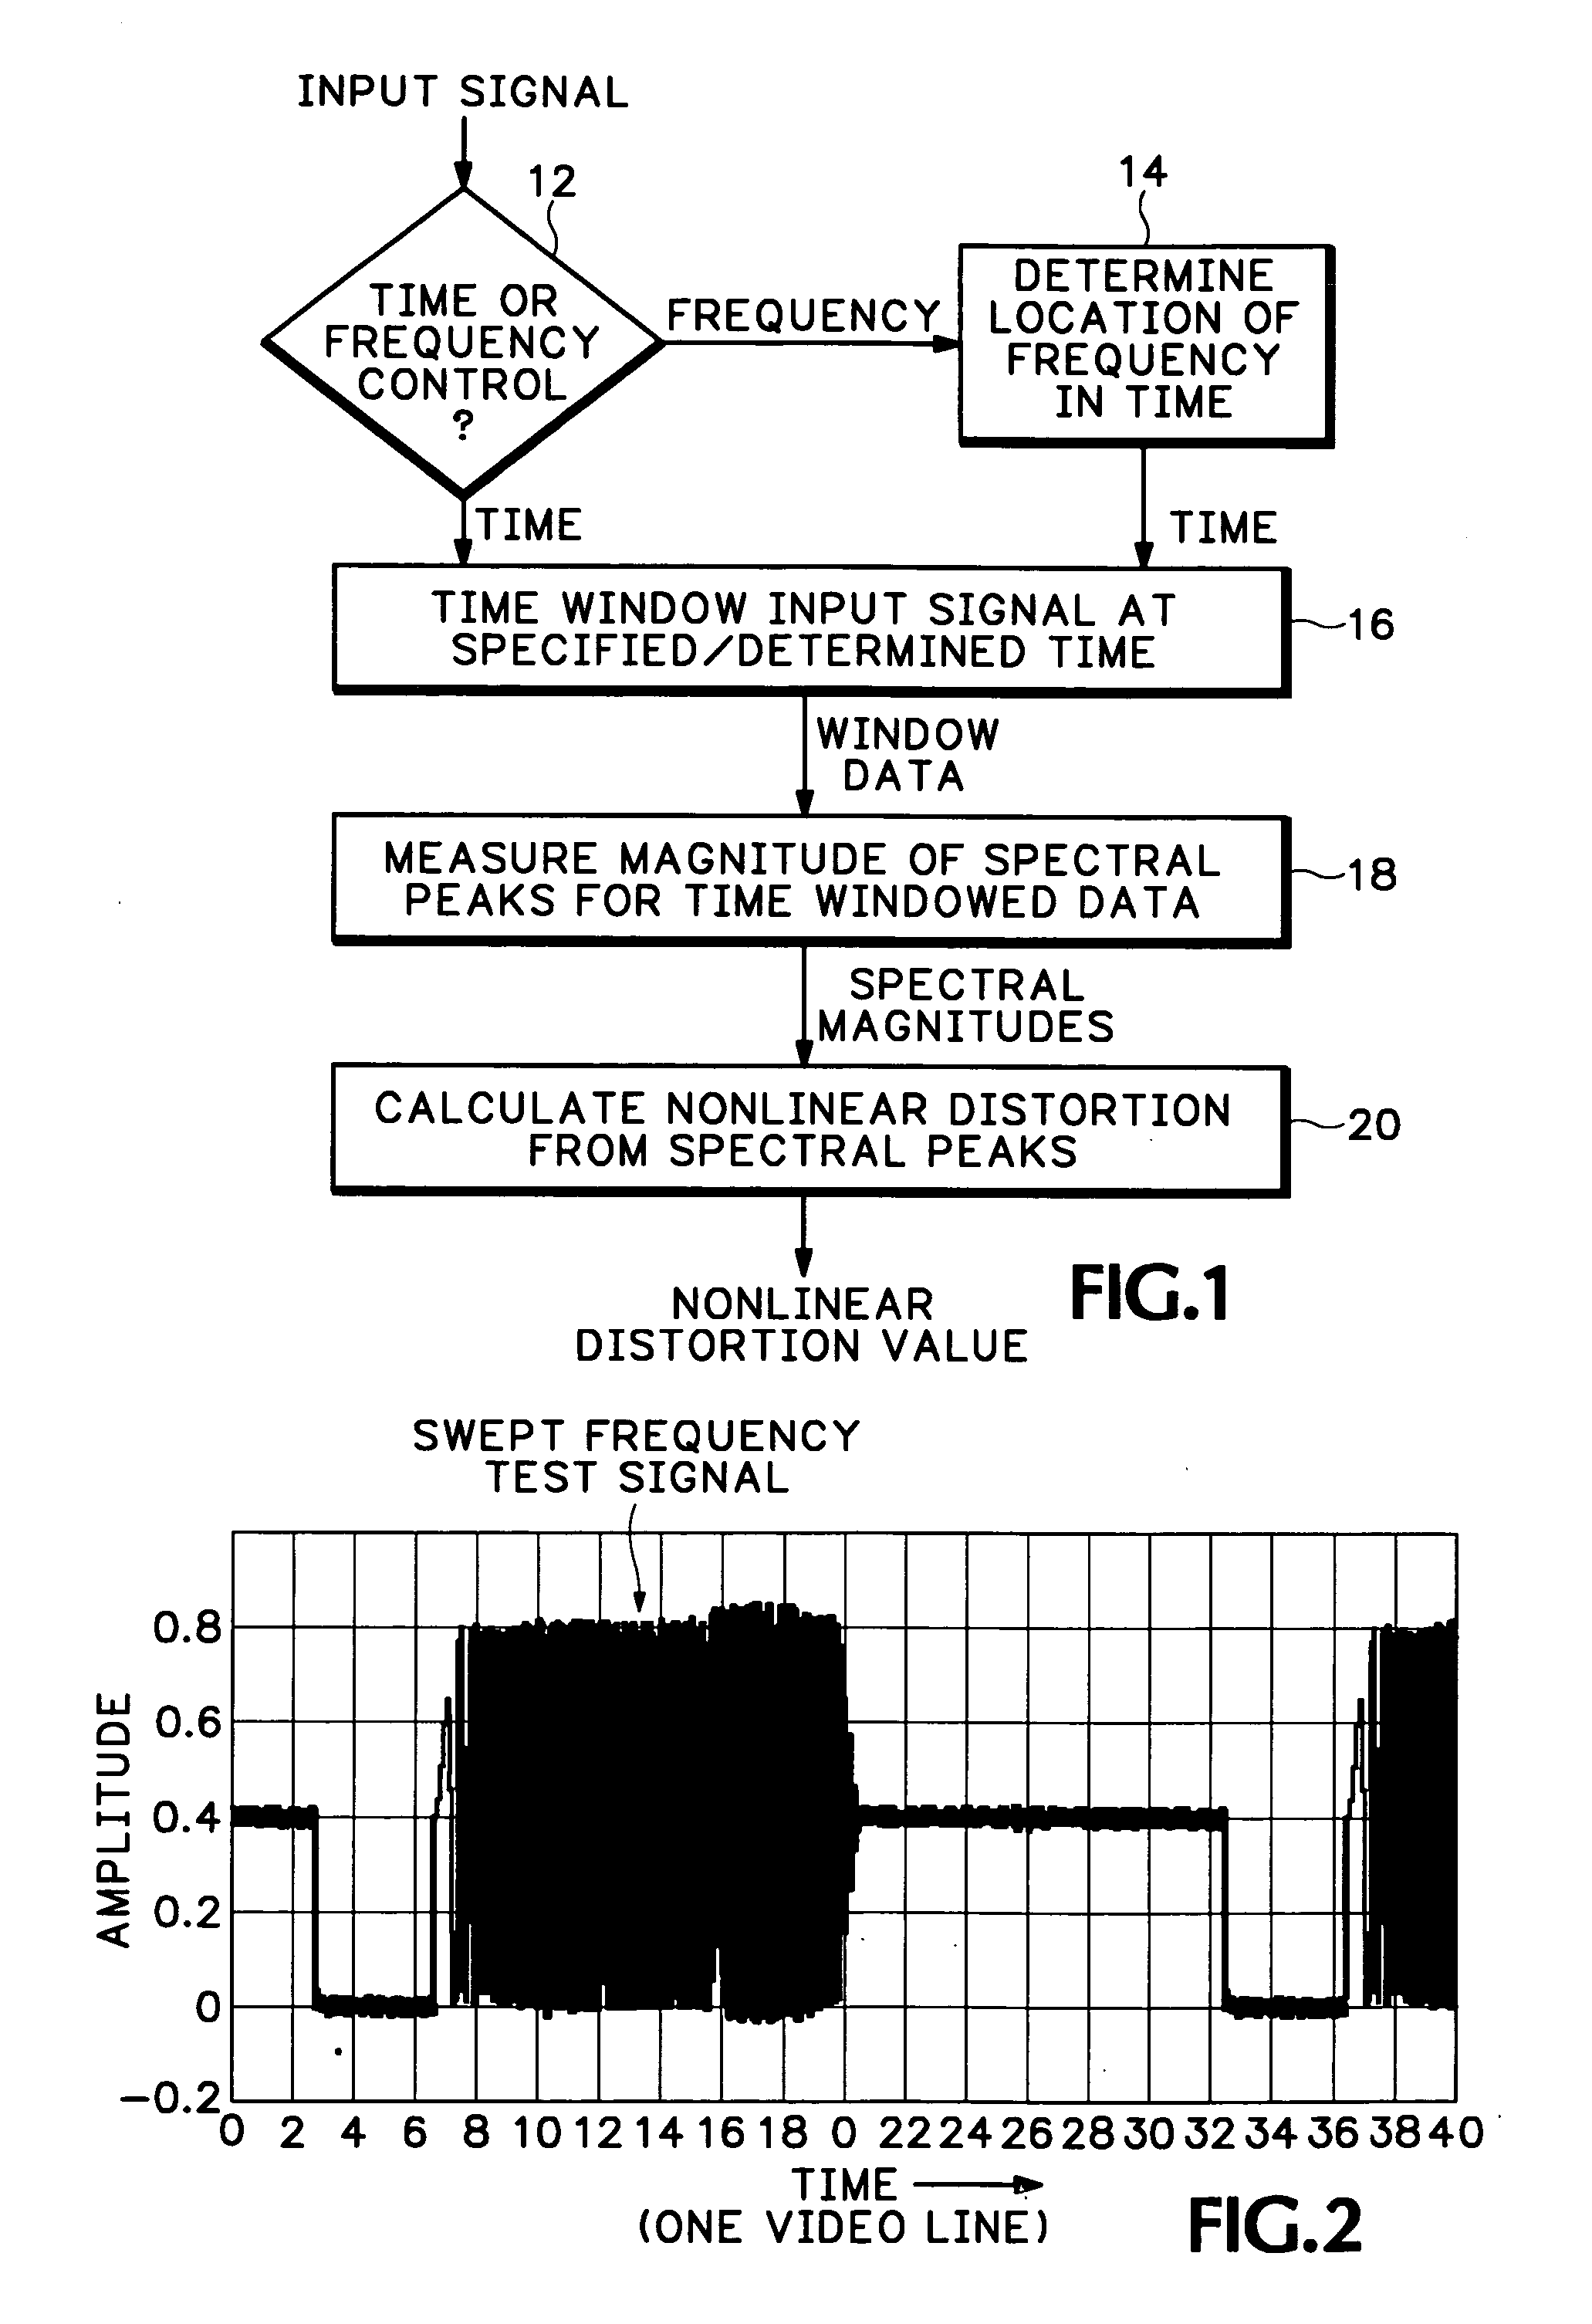
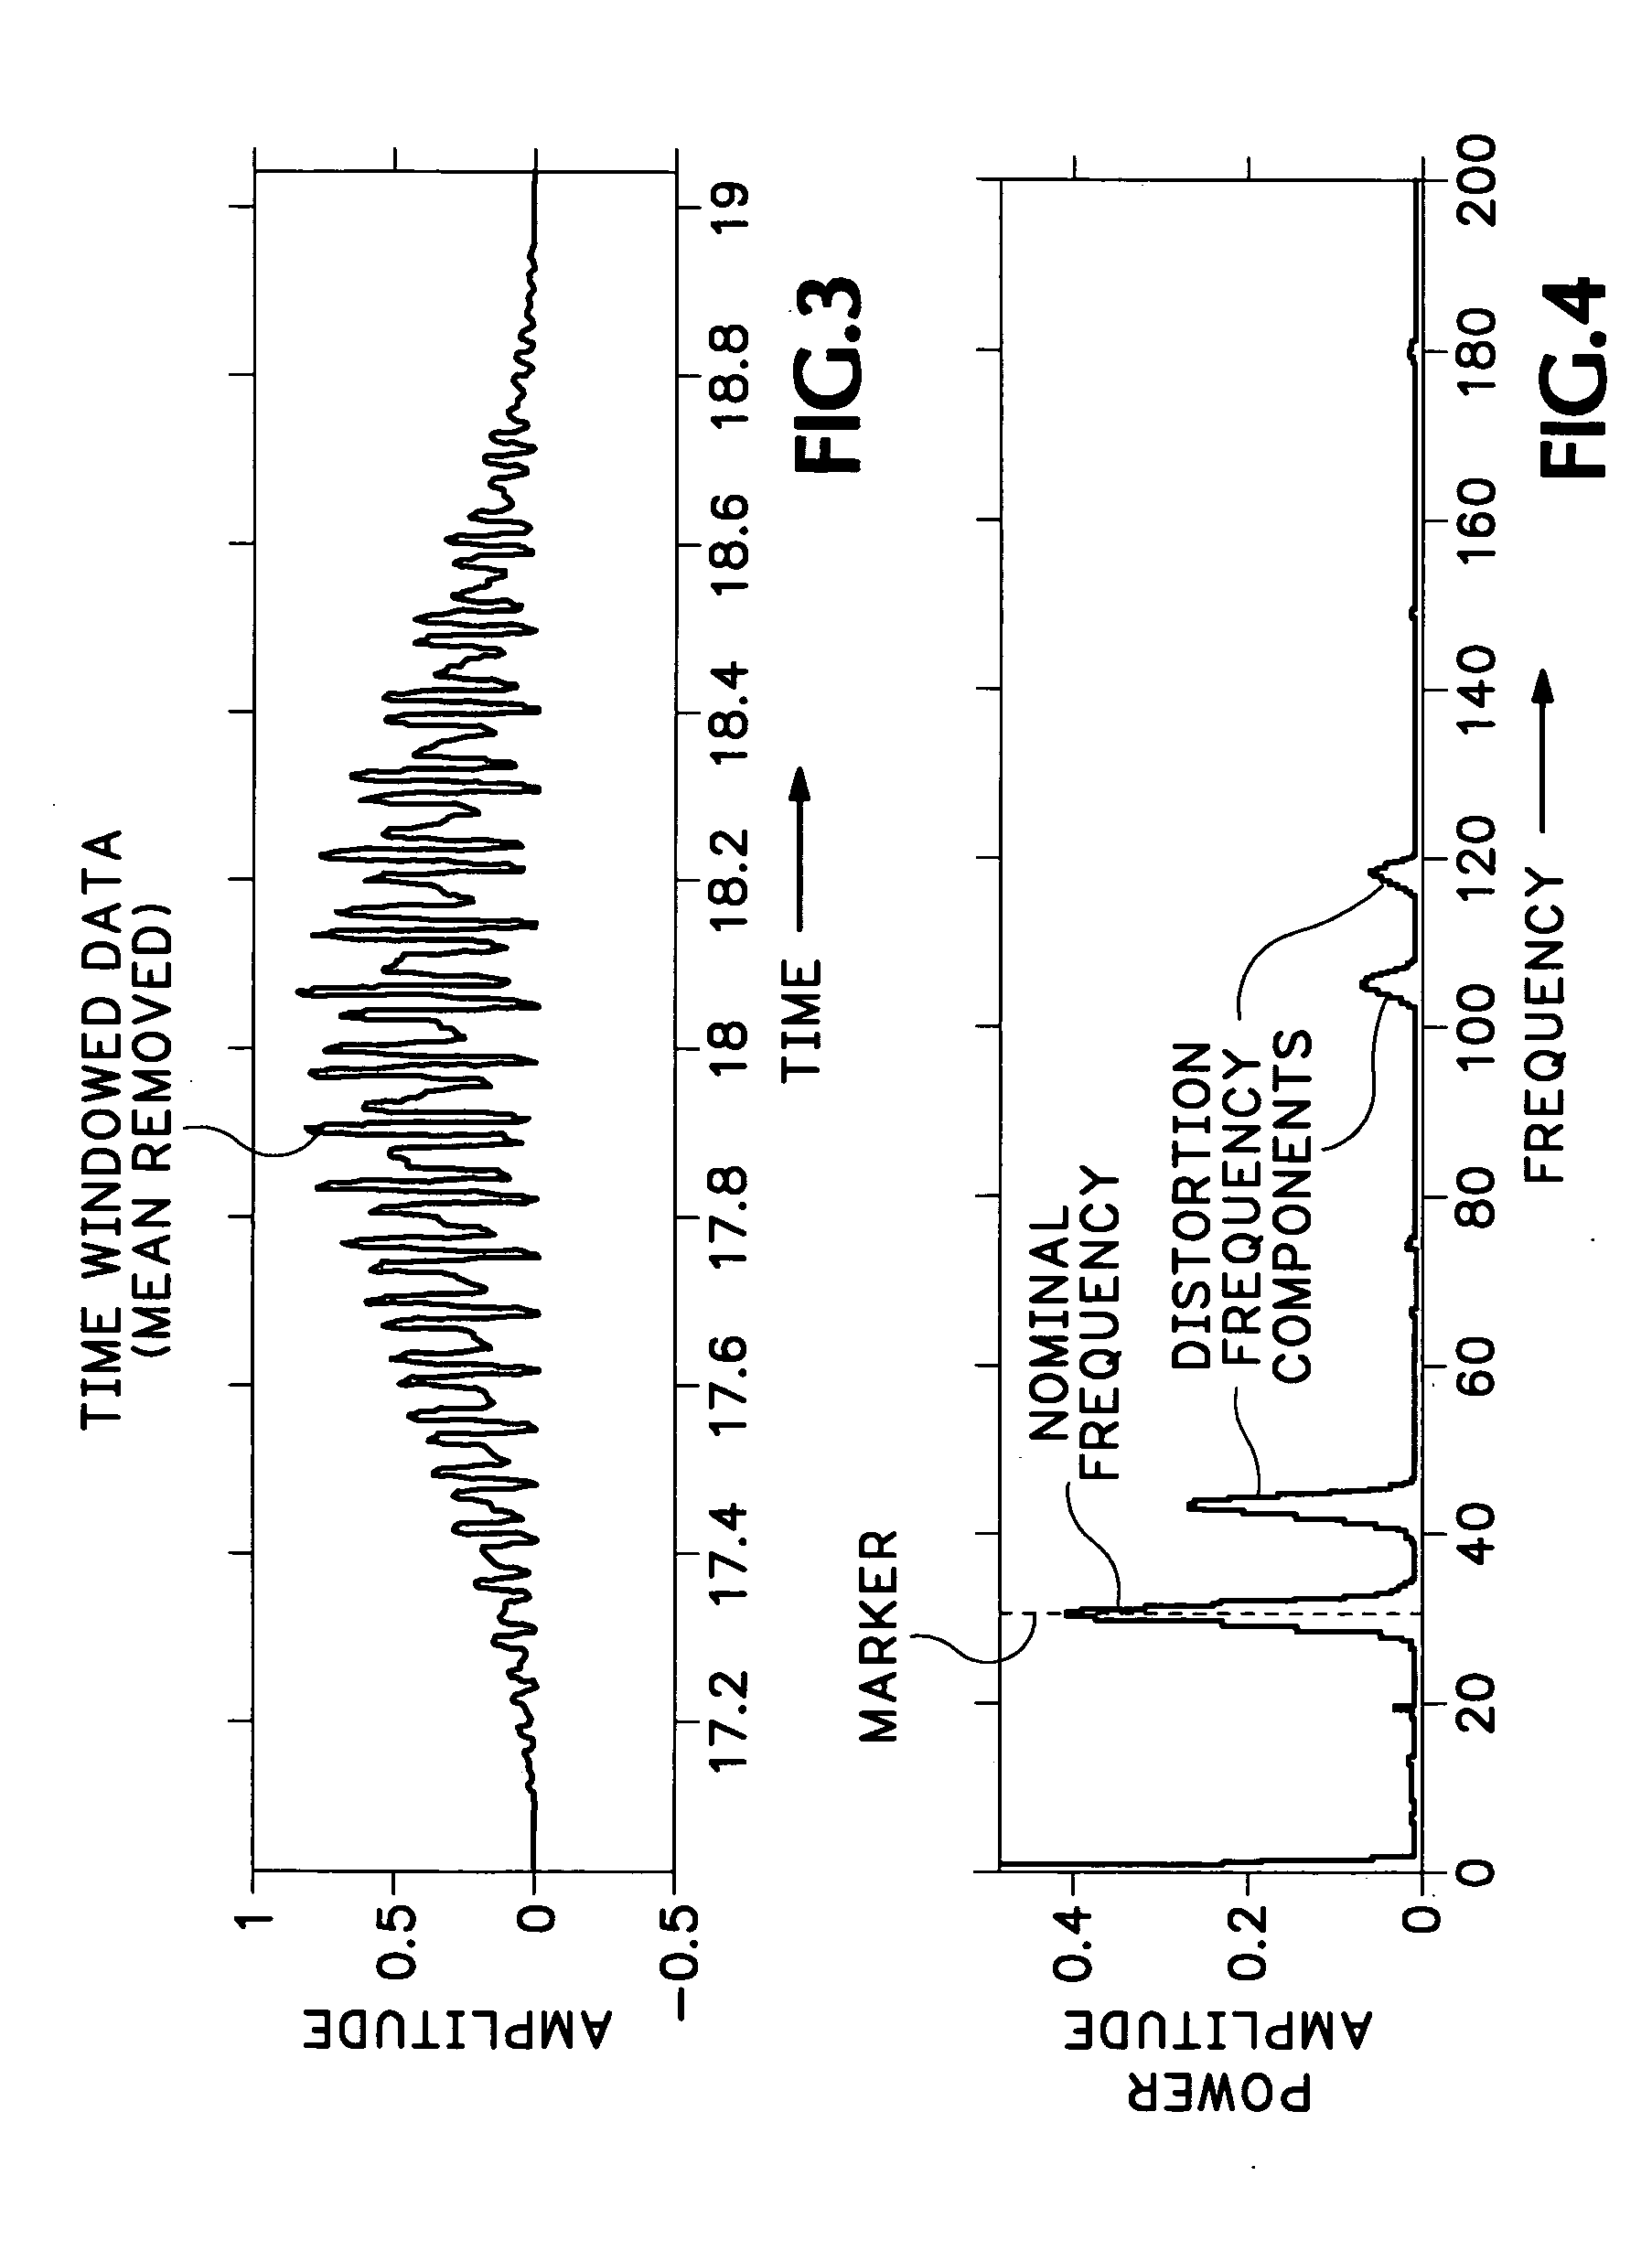
[0015] Referring now to FIG. 1 a method is shown for measuring nonlinear distortion in a varying frequency sinusoidal signal, either multi-burst or swept, output from a system under test. A narrow time window is used to produce time windowed data that represents a portion of the output signal that contains a frequency of interest. A spectrum of the time windowed data is used to determine magnitudes of spectral peaks. The magnitudes of the spectral peaks are used to determine instantaneous signal dependent nonlinear distortion for the system under test. There are two possible control inputs: frequency or time (step 12).

[0016] If a location of a particular frequency (frequency control input) is to be found, the method described in the afore-mentioned U.S. Patent Publication No. 12004-0161061-A1 is used to automatically determine a location (step 14) in time of the particular frequency within the output signal. The resulting location in time or the time control input is used to genera...


PUM


Abstract

A method of measuring instantaneous signal-dependent nonlinear distortion in a system under test in response to a test signal having a varying frequency sinusoidal component, such as a swept frequency signal or a multi-burst signal, uses a time window to locate a frequency of interest in the corresponding varying frequency component of a signal output from the system under test. Once the location of the frequency of interest is located in the output signal, a spectrum of the portion of the output signal within the time window is generated and the magnitudes of the spectral peaks, including the spectral peak for the frequency of interest or nominal frequency and all isolated peaks representing distortion frequencies, are measured. The amount of distortion is calculated as a ratio of the square-root of the sum of the magnitudes of the distortion frequencies to the magnitude of the nominal frequency.

Description

BACKGROUND OF THE INVENTION [0001] The present invention relates to signal distortion measurements, and more particularly to a method of measuring instantaneous signal dependent nonlinear distortion in a system under test in response to varying frequency sinusoidal test signals. [0002] Many users need to measure signal amplitude versus frequency of multi-burst and portions of swept sinusoidal test signals in the presence of noise, data compression artifacts and other nonlinear distortions such as frequency aliases common from television set-top boxes and computer graphics cards, quantization error and noise due to a test platform, etc. A multi-burst signal is a signal that has short bursts of sinusoidal signals at increasing, or decreasing, frequencies in a defined time interval, while a linear swept sinusoidal signal is one that linearly increases, or decreases, in frequency in the defined time interval. The variation in amplitude of the bursts or swept signal provide an indication...

Claims


Application Information

Patent Timeline
Patent Type & Authority Applications(United States)
IPC IPC(8): H04B10/04H04B10/12H04B17/00
CPCH04B17/345
Inventor FERGUSON, KEVIN M.
Owner TEKTRONIX INC
Why Eureka
Try Eureka