Relative and absolute calibration for dosimetric devices

a dosimetric device and relative and absolute calibration technology, applied in radiation therapy, instruments, therapy, etc., can solve the problems of increasing the cost and time consuming of the calibration process, and requiring additional equipment and time to gather data

Active Publication Date: 2006-07-20
RADIOLOGICAL IMAGING TECH
View PDF14 Cites 19 Cited by
  • Summary
  • Abstract
  • Description
  • Claims
  • Application Information

AI Technical Summary

Problems solved by technology

However, the greater the number of measurements, the more expensive and time consuming the calibration process becomes.
However, existing method

Method used


Image

  • Relative and absolute calibration for dosimetric devices
  • Relative and absolute calibration for dosimetric devices
  • Relative and absolute calibration for dosimetric devices

Examples


first embodiment

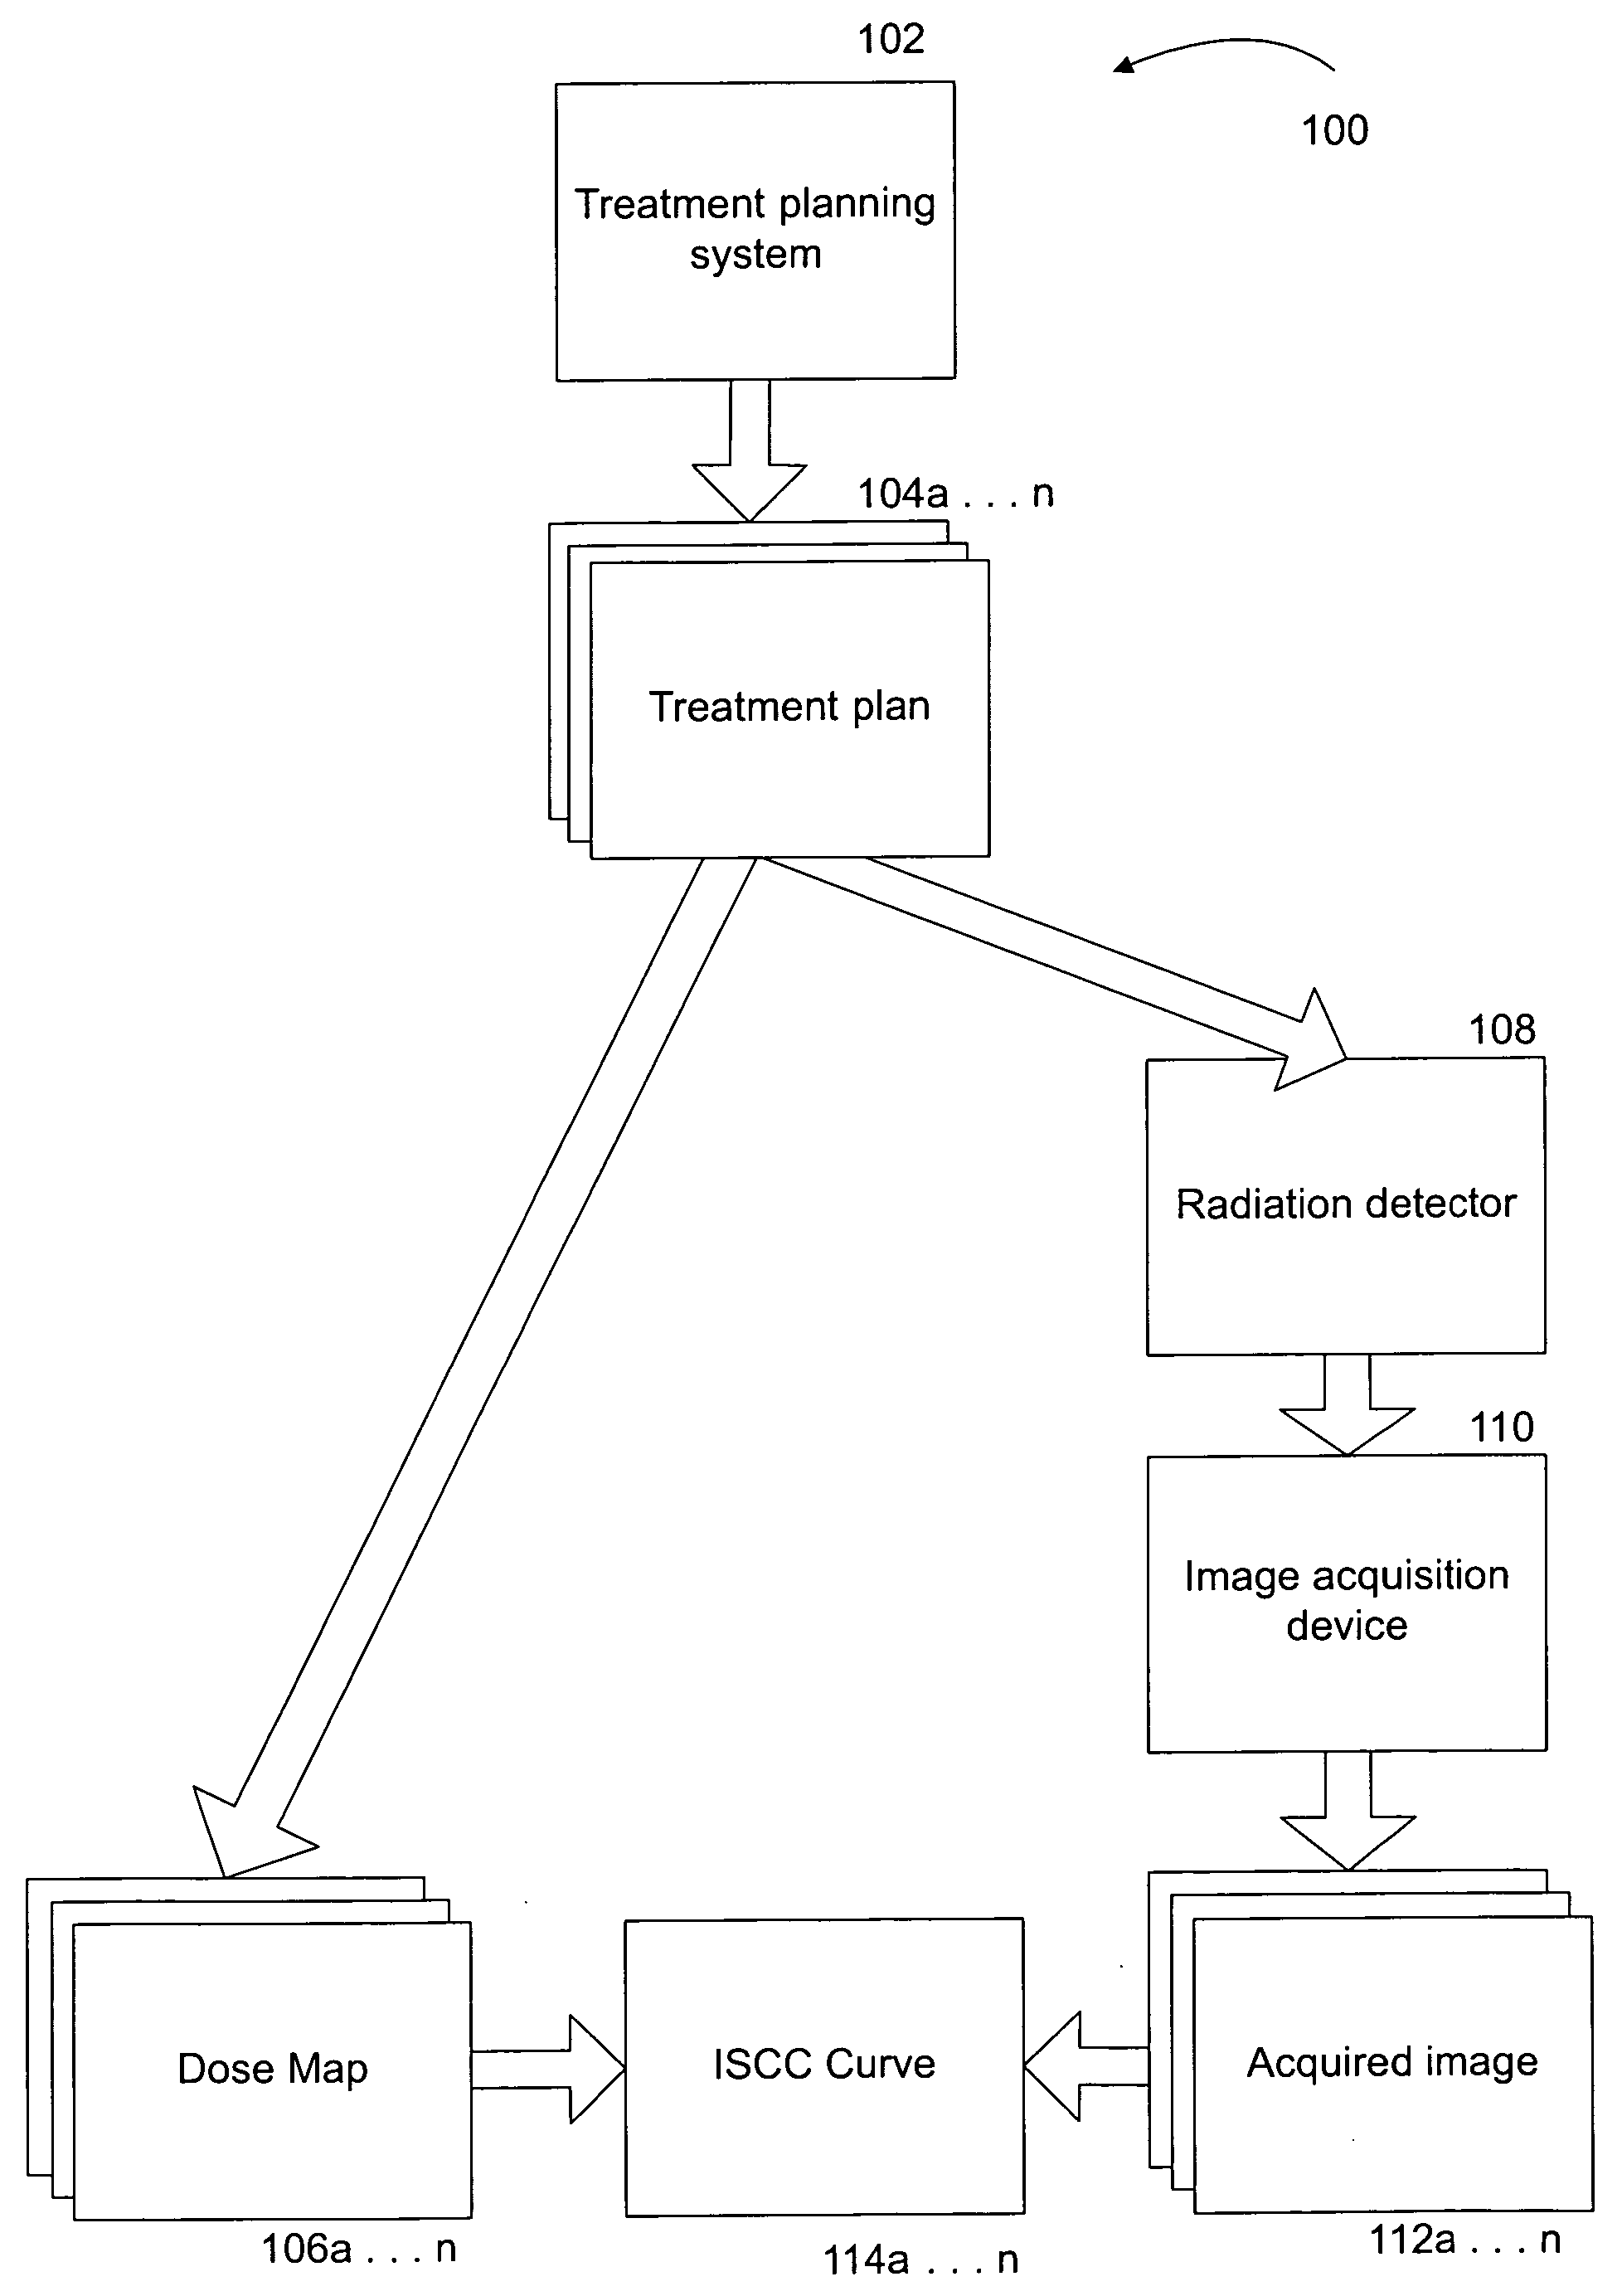
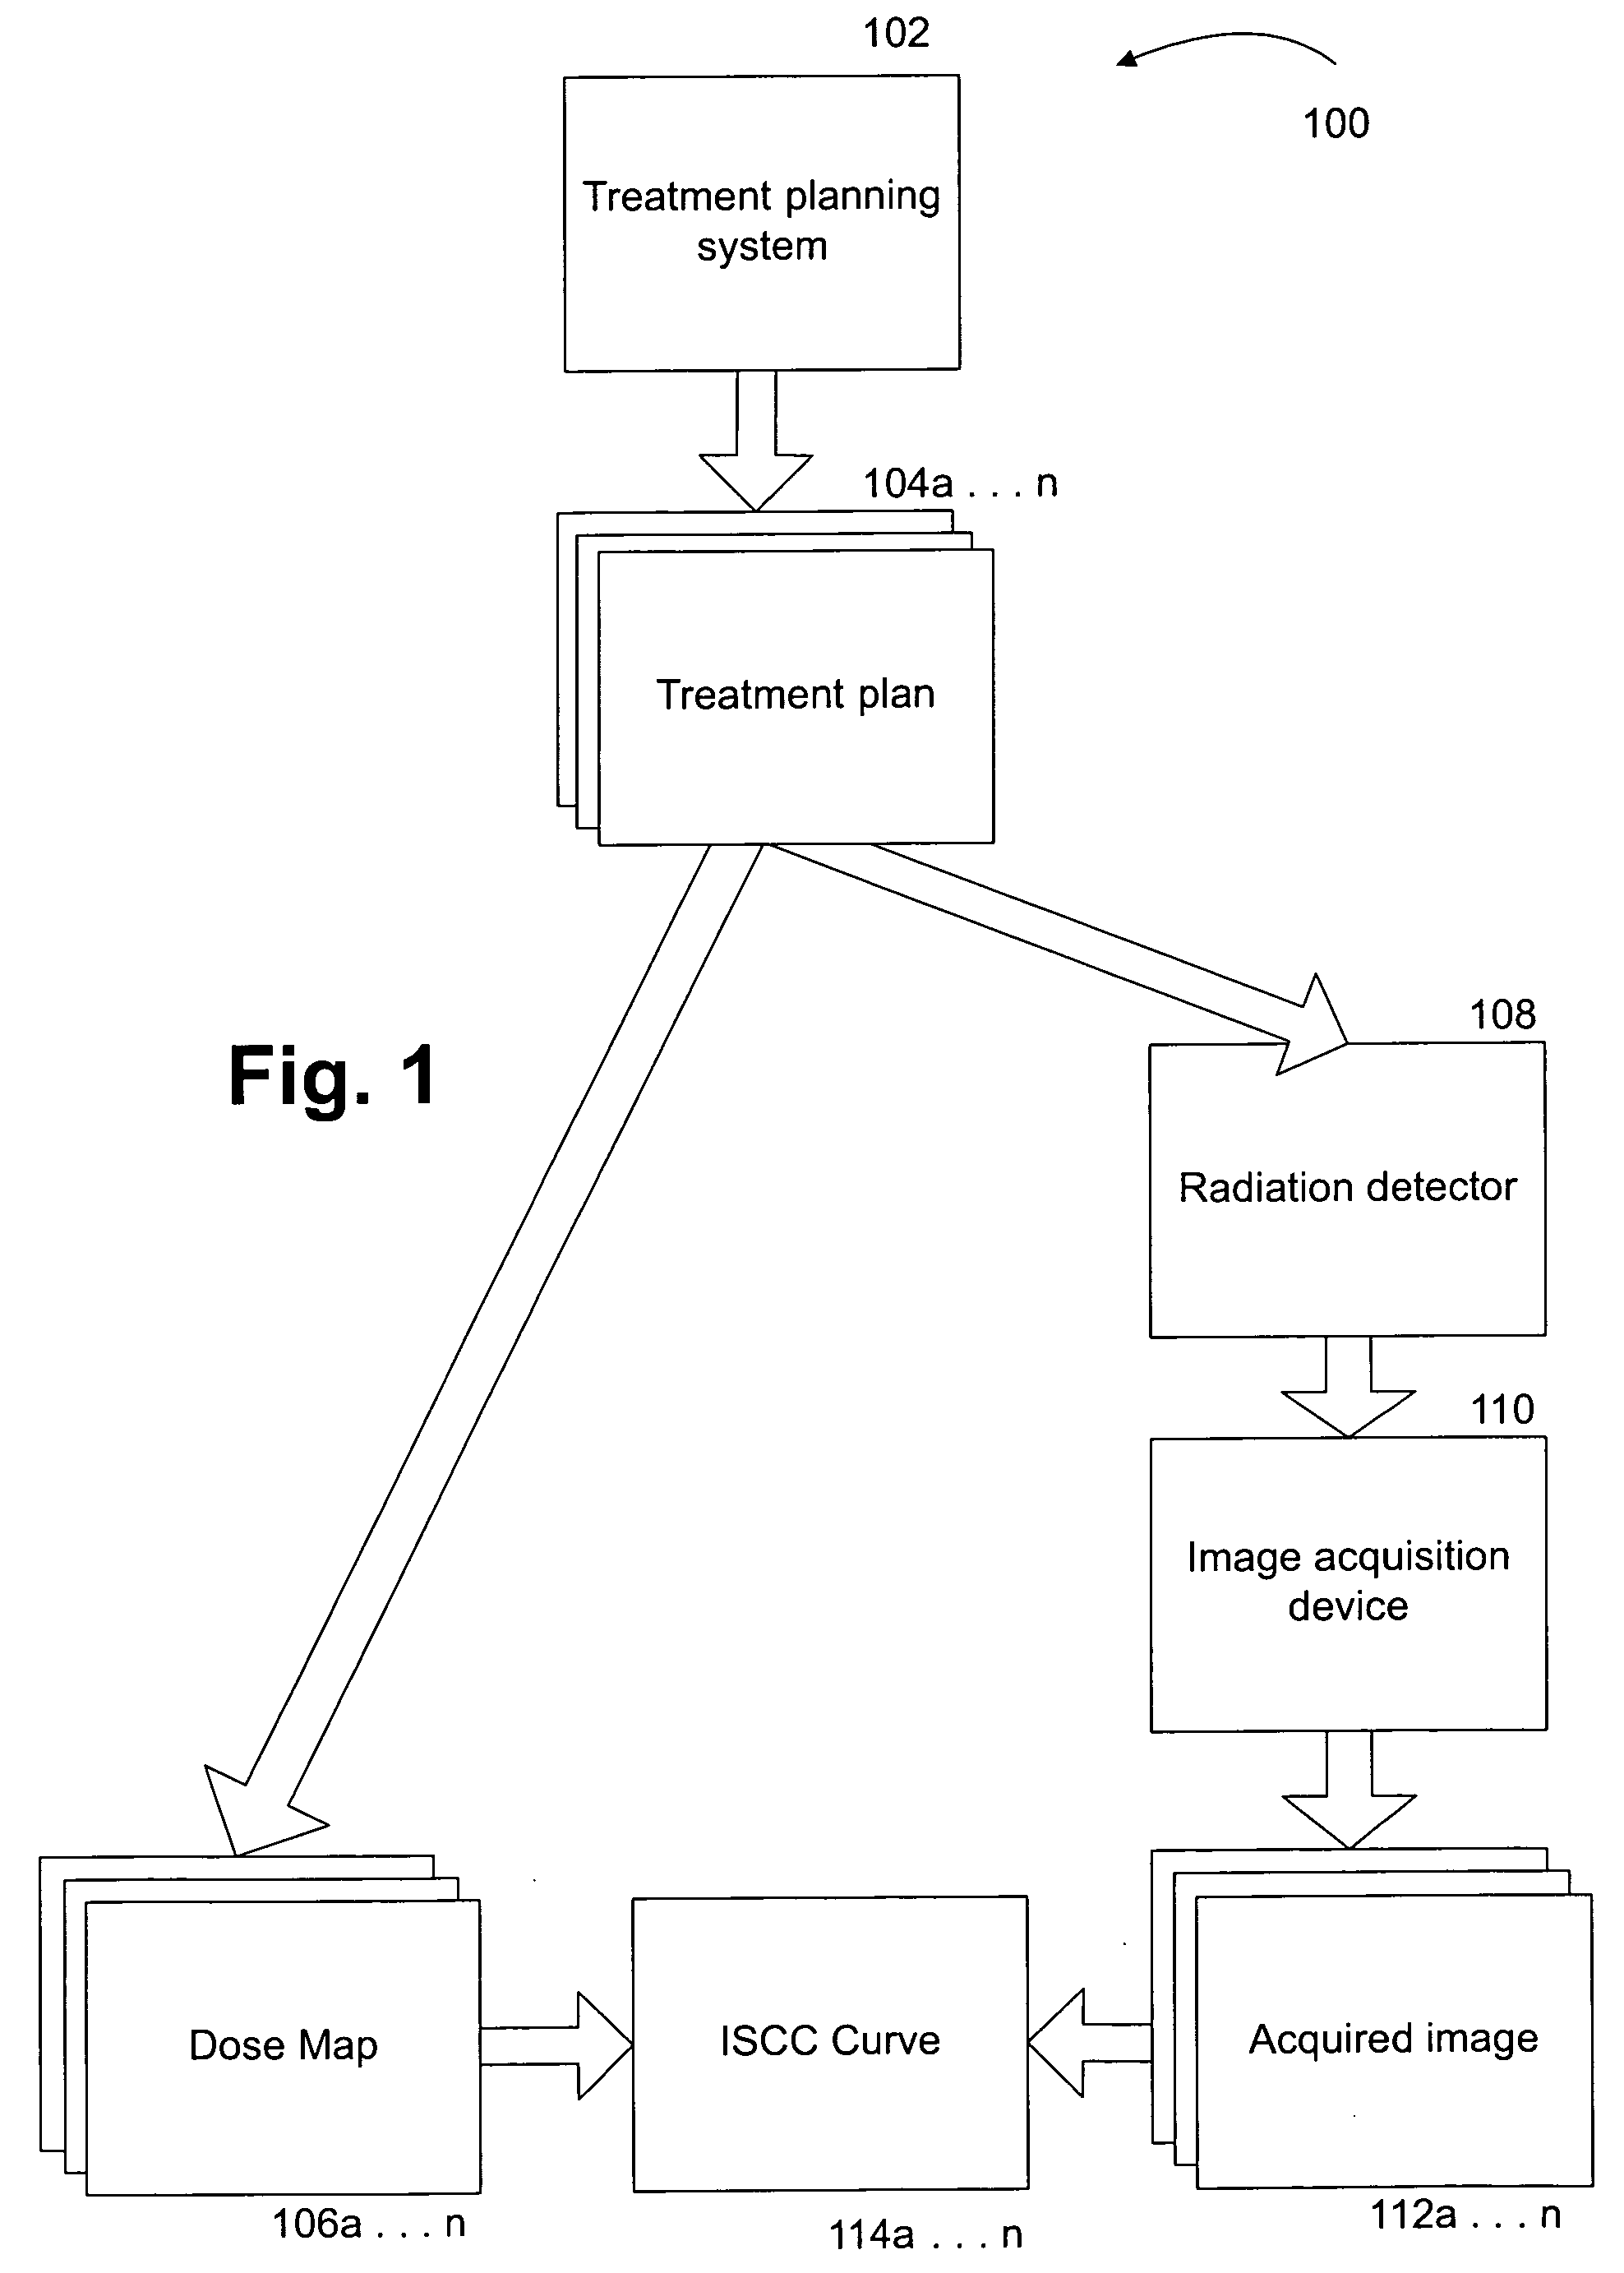
[0058] In a first embodiment, at step 312 dose map 106 is divided into small geometric areas. An example of a dose map 106 divided into small geometric areas (and after a statistical function has been applied to the areas, as described below) is shown in FIG. 7A. In one embodiment, the geometric areas are rectangles (or cubes for 3D images) that each include one percent of the area of the dose map 106. It should be noted that the geometric areas of the image may or may not be contiguous and may or may not physically overlap depending on the specific images employed.

second embodiment

[0059] In a second embodiment, at step 312 the dose levels on dose map 106 are divided into dose ranges. These dose ranges may or may not be contiguous and may or may not overlap. In one embodiment each dose range covers 1% of the total dose range on the plan image. That is, each 1% increment covers the range from 0 to the maximum dose on dose map 106 on a scale of 0 to 100. For each range of pixels in the dose curve a statistical measure such as the mean or the median is calculated. That is, the process finds all the pixels in each dose range on the plan image, i.e., dose map 106, and takes the mean (or median or some other measure of central tendency) of those pixels. An index locating the pixels on the registered images in each range is maintained.

third embodiment

[0060] In yet a third embodiment, at step 312, dose map 106 is divided into sub-regions such as the geometric areas described above comprising a percentage of the area of dose map 106. Dose map 106 is then translated into what is referred to as “column format.” It should be understood that use of column format is optionally employed for the sake of simplifying the process but that steps 312 and the steps following step 312 could be practiced without representing dose map 106 and acquired image 112 in column format. An example of a dose map 106 in column format is shown in FIG. 9A. Individual sub-regions of the dose map 106 shown in FIG. 6A are represented in individual columns of the image shown in FIG. 9A.

[0061] In the first embodiment discussed with reference to step 312, at step 314 pixels are located on the acquired image 112 that correspond to each geometric area of dose map 106, defined as described above with respect to step 312. Dose map 106 and acquired image 112 may option...


PUM


Abstract

A first self-calibration curve relates a first array image to a first acquired image, the first array image being recorded from application of a first radiation treatment plan to a detector array, and the first acquired image being recorded from application of the first radiation treatment plan to a radiation detector. At least one subsequent self-calibration curve relates at least one subsequent array image to at least one subsequent acquired image, the subsequent array image being recorded from application of at least one subsequent radiation treatment plan to the detector array, and the subsequent acquired image being recorded from application of the subsequent radiation treatment plan to the radiation detector. In some embodiments, the detector array is pre-calibrated to a predefined standard.

Description

RELATED APPLICATIONS [0001] This application is a continuation-in-part of presently pending U.S. patent application Ser. No. 11 / 181,057, filed Jul. 14, 2005, entitled RELATIVE CALIBRATION FOR DOSIMETRIC DEVICES, which is a divisional of U.S. patent application Ser. No. 11 / 039,704, filed Jan. 20, 2005, entitled RELATIVE CALIBRATION FOR DOSIMETRIC DEVICES, both of which are hereby incorporated by reference in their entireties. [0002] This application is related to presently pending U.S. patent application Ser. No. 10 / 445,587, filed May 27, 2003, entitled SYSTEM OR METHOD FOR CALIBRATING A RADIATION DETECTION MEDIUM, which is a continuation of the application for U.S. Pat. No. 6,675,116, filed Jun. 1, 2001, claiming priority to U.S. provisional application 60 / 234,745, filed Sep. 22, 2000, and 60 / 252,705, filed Nov. 22, 2000. This application is also related to the application for U.S. Pat. No. 6,528,803, filed Jan. 21, 2000. This application is also related to pending U.S. application ...

Claims


Application Information

Patent Timeline
IPC IPC(8): G06K9/00
CPCA61N5/1048G01T7/005
Inventor RITT, DANIEL M.WHITAKER, MATTHEW L.
Owner RADIOLOGICAL IMAGING TECH
Why Eureka
Try Eureka