
Method for measuring density, printing method, method of calculating correction value, method of manufacturing printing apparatus and method for obtaining correction value

a printing method and density measurement technology, applied in the field of density measurement, can solve the problems of coefficients that cannot properly reflect the characteristics of the ccd sensor, and uneven density in the print image, so as to achieve the effect of suppressing uneven density

Inactive Publication Date: 2006-11-23
SEIKO EPSON CORP
View PDF12 Cites 9 Cited by
  • Summary
  • Abstract
  • Description
  • Claims
  • Application Information

AI Technical Summary

Benefits of technology

[0012] Therefore, an advantage of a method for measuring density of the invention is to modify measured values of density properly. In addition, an advantage of a method for obtaining a correction value of the invention is to obtain a correction value which is appropriate to correct unevenness in density. It should be noted that in a technology for correcting unevenness in density disclosed in JP-A-6-166247, image data is corrected based on a correction value corresponding to each nozzle.
[0014] Accordingly, in the invention, unevenness in density is suppressed by storing a correction value corresponding to a row region in which a dot row is to be formed and correcting density of each piece of image depending on the correction value.

Problems solved by technology

As a result thereof, a streaky unevenness in density occurs in the print image.
Accordingly, depending on a method for obtaining these coefficients, there are cases in which these coefficients cannot reflect characteristics of the CCD sensor properly.
If these coefficients do not reflect characteristics of the CCD sensor properly, unevenness in density occurs in a print image.
However, if an image sensor cannot read the patterns for detecting unevenness in density properly, unevenness in density cannot be corrected properly and unevenness in density occurs in a print image.
However, there are cases in which there is difference in density of color even among pieces of image formed by the same nozzle.
In this case, the correction value corresponding only to each nozzle cannot suppress unevenness in density.

Method used


Image

  • Method for measuring density, printing method, method of calculating correction value, method of manufacturing printing apparatus and method for obtaining correction value
  • Method for measuring density, printing method, method of calculating correction value, method of manufacturing printing apparatus and method for obtaining correction value
  • Method for measuring density, printing method, method of calculating correction value, method of manufacturing printing apparatus and method for obtaining correction value

Examples


first embodiment (

The First Embodiment (Modification of Measured Values)

[0226] In the present embodiment, in order to prevent adverse effects caused by the gradient of a graph of measured values, the gradient of the graph of the measured values is modified and, correction values are calculated based on the modified measured values.

[0227]FIG. 30A is a graph of measured values before modification. The measured values mentioned in this section are the same as shown in the graph in FIG. 25B.

[0228] A program for obtaining correction values obtains measured values of density of each of row regions in the range of the twenty-first through 106th row regions which is the range to be covered by the calculation. The reason why the first through twentieth row regions, which are located more downstream in the carrying direction than this range to be covered by the calculation, are excluded from the range to be covered by the calculation is because it is possible that the first through twentieth row regions are ...

second embodiment (

The Second Embodiment (Modification of Correction Value)

[0235]FIG. 32A is an explanatory diagram showing correction values before modification. FIG. 32B is an explanatory diagram showing correction values after modification. It should be noted that on calculation of correction values in the second embodiment, measured values are not modified as described in the first embodiment. Here, first, a front-end modification value is described.

[0236] First, a program for obtaining correction values obtains correction values of ten row regions, five each before and after a boundary between each of print regions, in order to calculate the front-end modification value. Here, the program for obtaining correction values obtains the correction values of the twenty-fifth through thirtieth row regions in the front-end print region and the correction values of the first through fifth row regions in the regular print region.

[0237] Then, the program for obtaining correction values calculates respecti...

third embodiment (

The Third Embodiment (Modification of Measured Values and Modification of Correction Values)

[0243] In the present embodiment, in order to prevent adverse effects caused by the gradient of a graph of measured values, the gradient of the graph of the measured values is modified and correction values are calculated based on the modified measured values. Modification of the measured values is not described because it is the same as the first embodiment mentioned above.

[0244]FIG. 30B is a graph of the measured values after modification. The gradient of the graph is eliminated throughout the modified measured values. A program for obtaining correction values calculates the correction values based on these modified measured values.

[0245]FIG. 33A is an explanatory diagram showing correction values before modification. FIG. 33B is an explanatory diagram showing correction values after modification. Even if the correction values are calculated after modification of the gradient of the measu...


PUM


Abstract

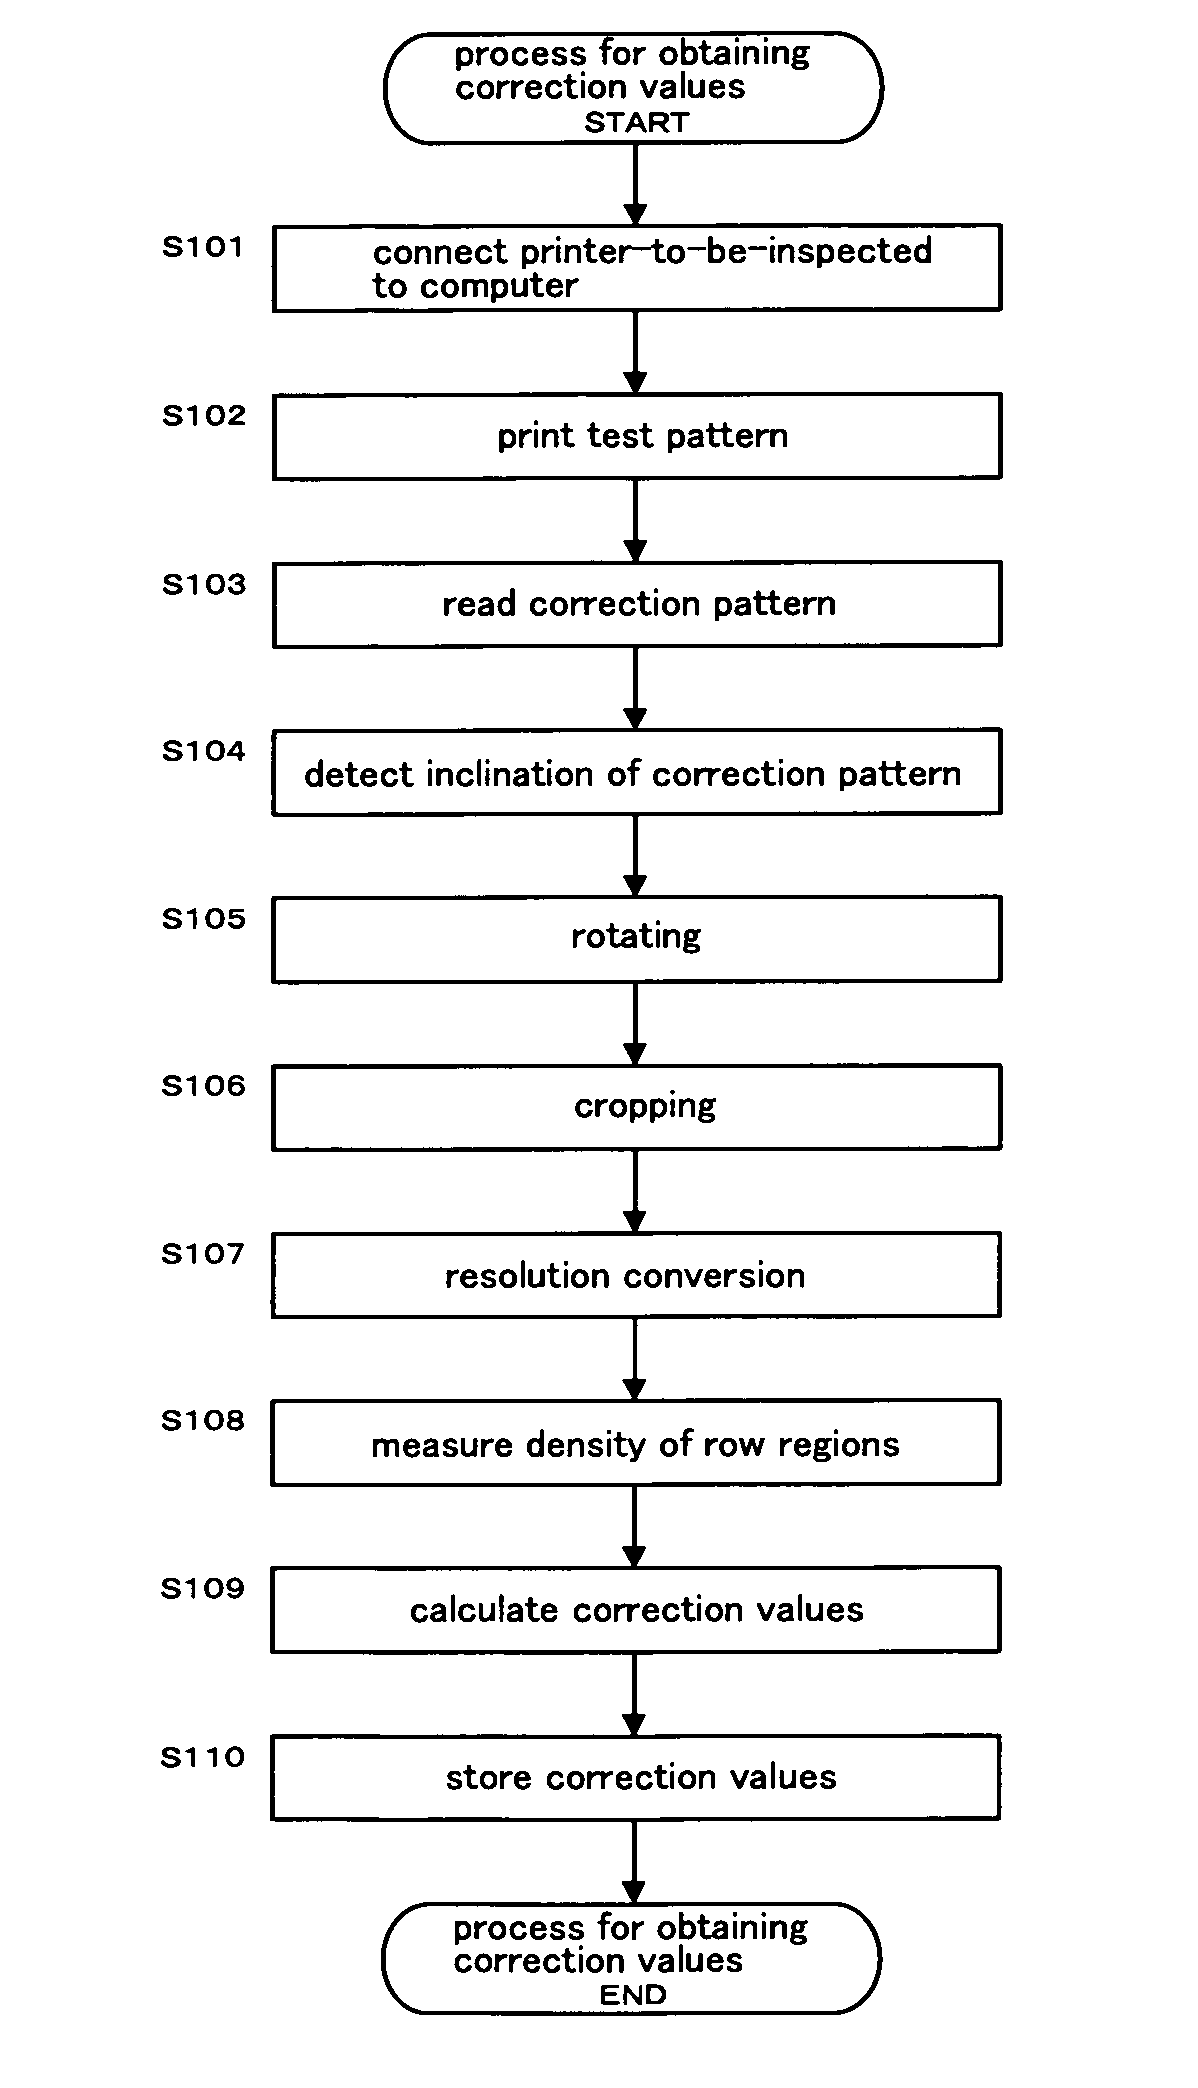
A method for measuring density, includes: forming on a medium a pattern that consists of a plurality of dot rows formed respectively in a plurality of row regions lined up in a direction intersecting a movement direction in which a plurality of nozzles move, by forming each of the dot rows in the row region arranged in the movement direction by ejecting ink from the nozzles; reading the pattern by a scanner; measuring density of each of the row regions of the read pattern; calculating respective modification values corresponding to each of the row regions, based on at least a part of a measurement result of the density of the plurality of the row regions; and modifying respective measured values of the density of each of the row regions based on the respective modification values corresponding to each of the row regions.

Description

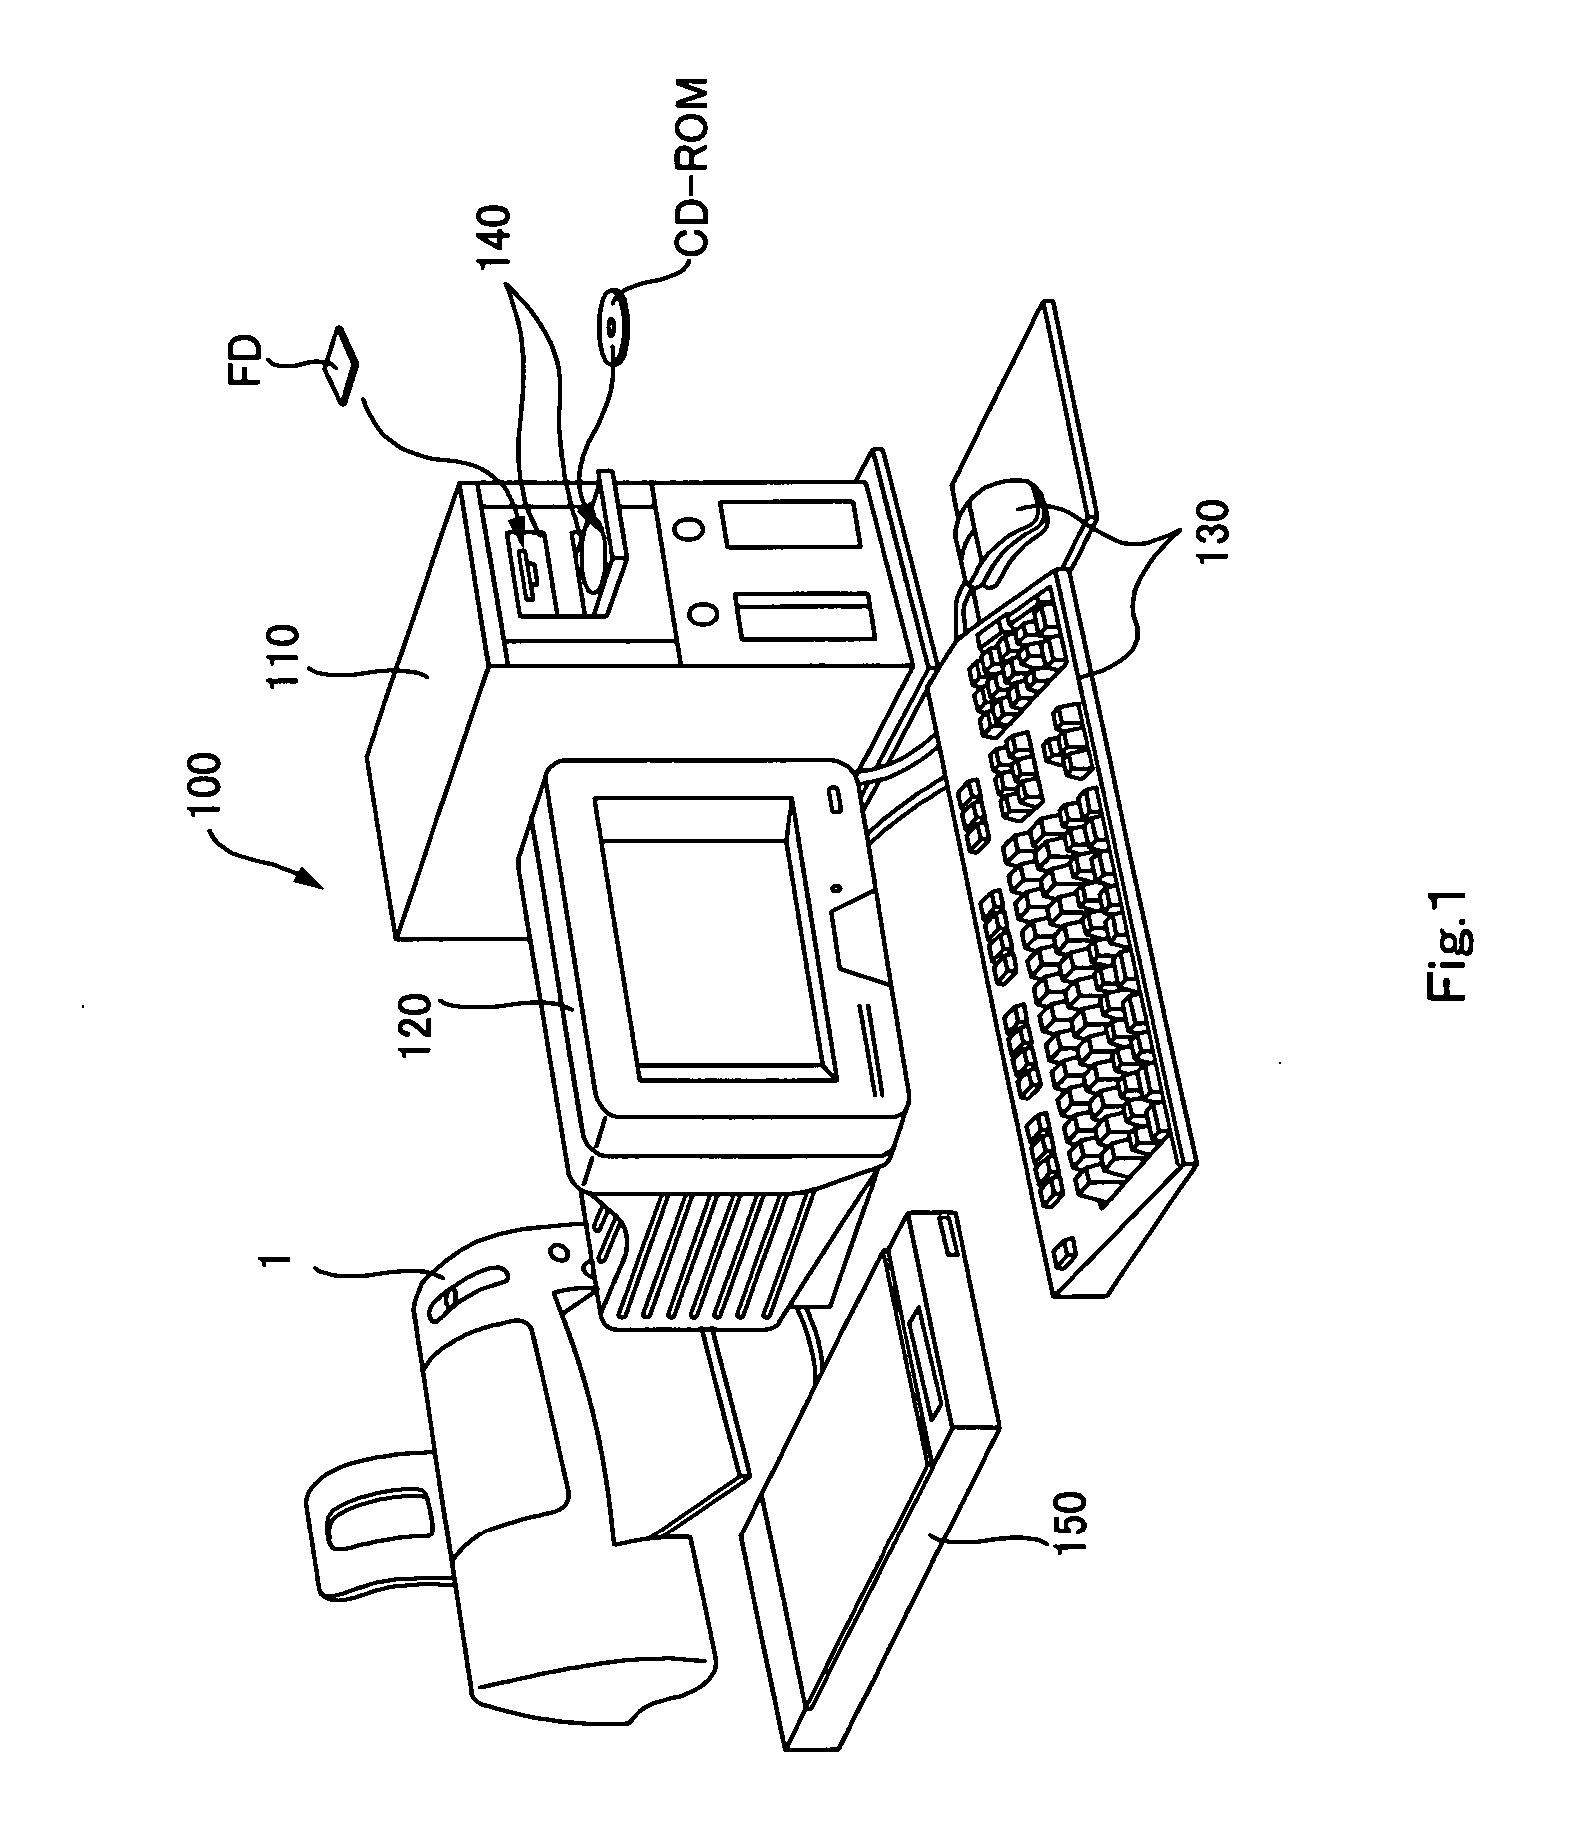
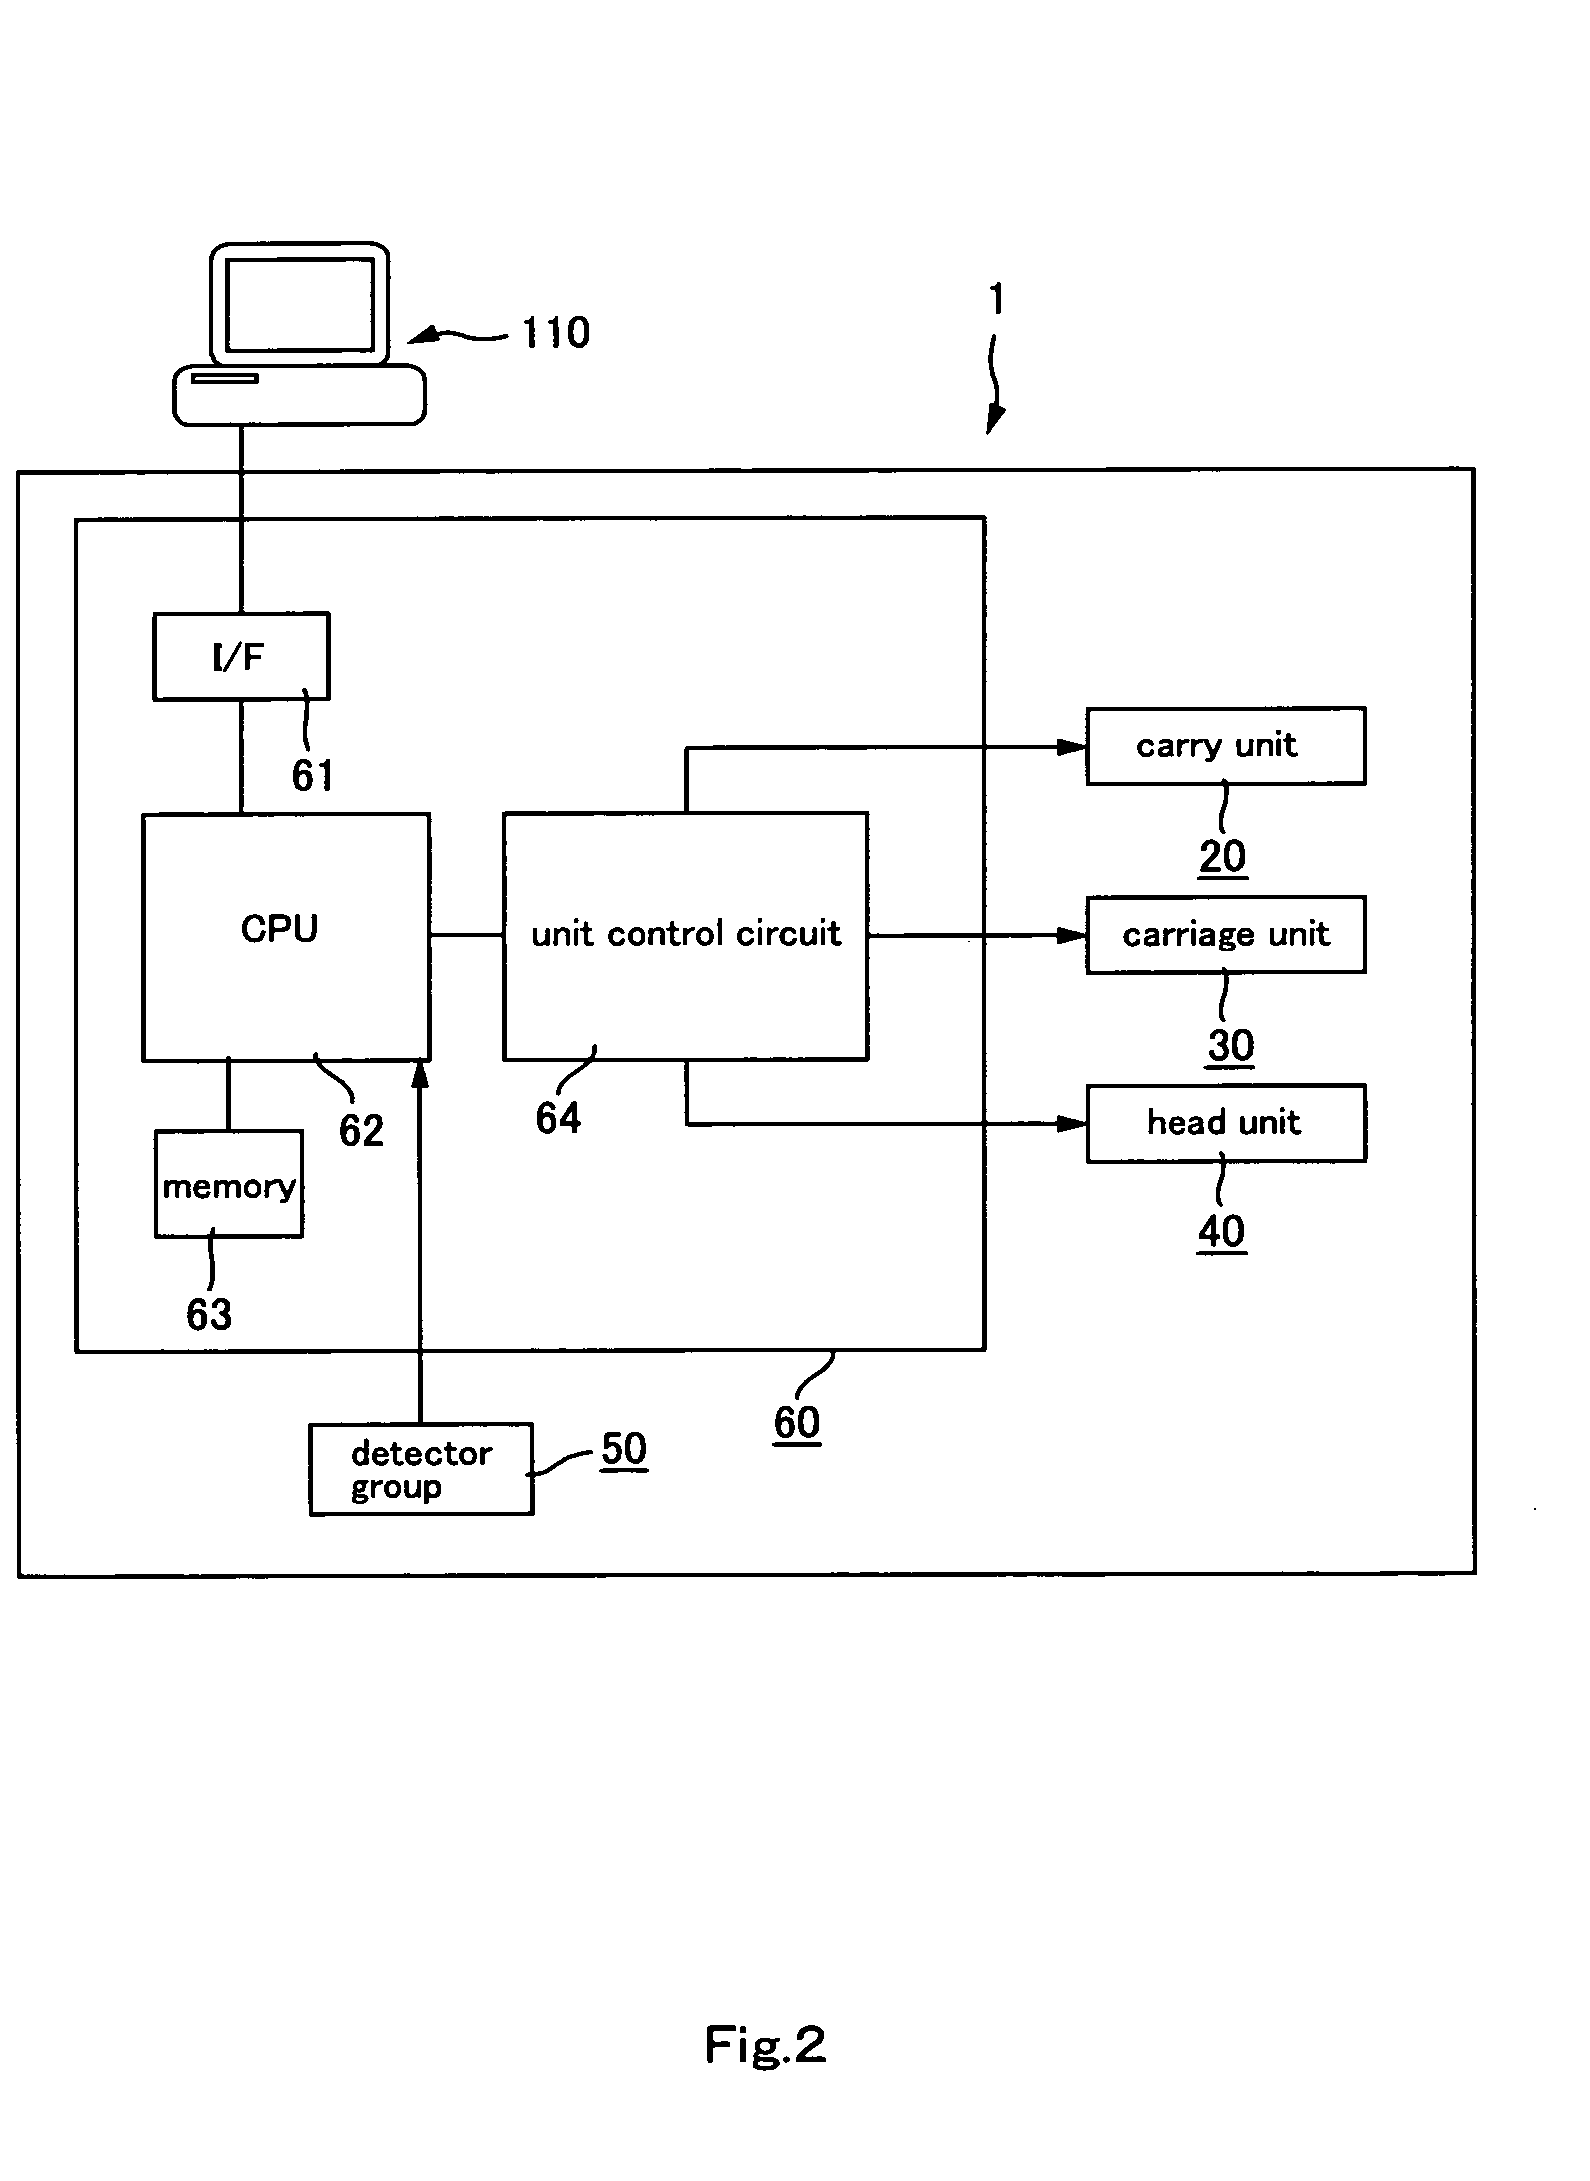
CROSS-REFERENCE TO RELATED APPLICATIONS [0001] The present application claims priority from Japanese Patent Applications No. 2005-133699 and No. 2005-133701 filed on Apr. 28, 2005, which are herein incorporated by reference. BACKGROUND [0002] 1. Technical Field [0003] The invention relates to a method for measuring density, a printing method, a method of calculating a correction value, a method of manufacturing a printing apparatus, and a method for obtaining a correction value. [0004] 2. Related Art [0005] There is known a printing apparatus which prints a print image on a medium (such as paper, cloth, and OHP film) by repeating alternately the following actions: a dot formation action in which dots are formed on the medium by ejecting ink from a head moving in a movement direction and a carrying action in which the medium is carried. The print image printed with the printing apparatus is formed by lining up in a carrying direction a myriad of pieces of image which consist of dot r...

Claims


Application Information

Patent Timeline
IPC IPC(8): H04N1/46
CPCB41J29/393B41J2/2132
Inventor NAKANO, TATSUYAYOSHIDA, MASAHIKOYAMASAKI, KEIGO
Owner SEIKO EPSON CORP
Learn More