System and method for applying link analysis tools for visualizing connected temporal and spatial information on a user inferface

a temporal and spatial information and link analysis technology, applied in the field of interactive visual presentation of multidimensional data, can solve problems such as problems in simplifying or otherwise analyzing cluttered visualizations with respect, and in changing the content of visualizations

Active Publication Date: 2007-03-08
PEN LINK LTD
View PDF5 Cites 71 Cited by
  • Summary
  • Abstract
  • Description
  • Claims
  • Application Information

AI Technical Summary

Problems solved by technology

There exists problems in simplifying or otherwise analyzing cluttered visualizations with respect to identifying relevant data elements associated with one another from non-associated data elements, in particular in environments with both temporal and spatial properties.
Further, problems exist in changing the content of a visualization to assist the analyst in interpretation of identified data elements.

Method used


Image

  • System and method for applying link analysis tools for visualizing connected temporal and spatial information on a user inferface
  • System and method for applying link analysis tools for visualizing connected temporal and spatial information on a user inferface
  • System and method for applying link analysis tools for visualizing connected temporal and spatial information on a user inferface

Examples


example objects 14

Example Objects 14 with Associations 16

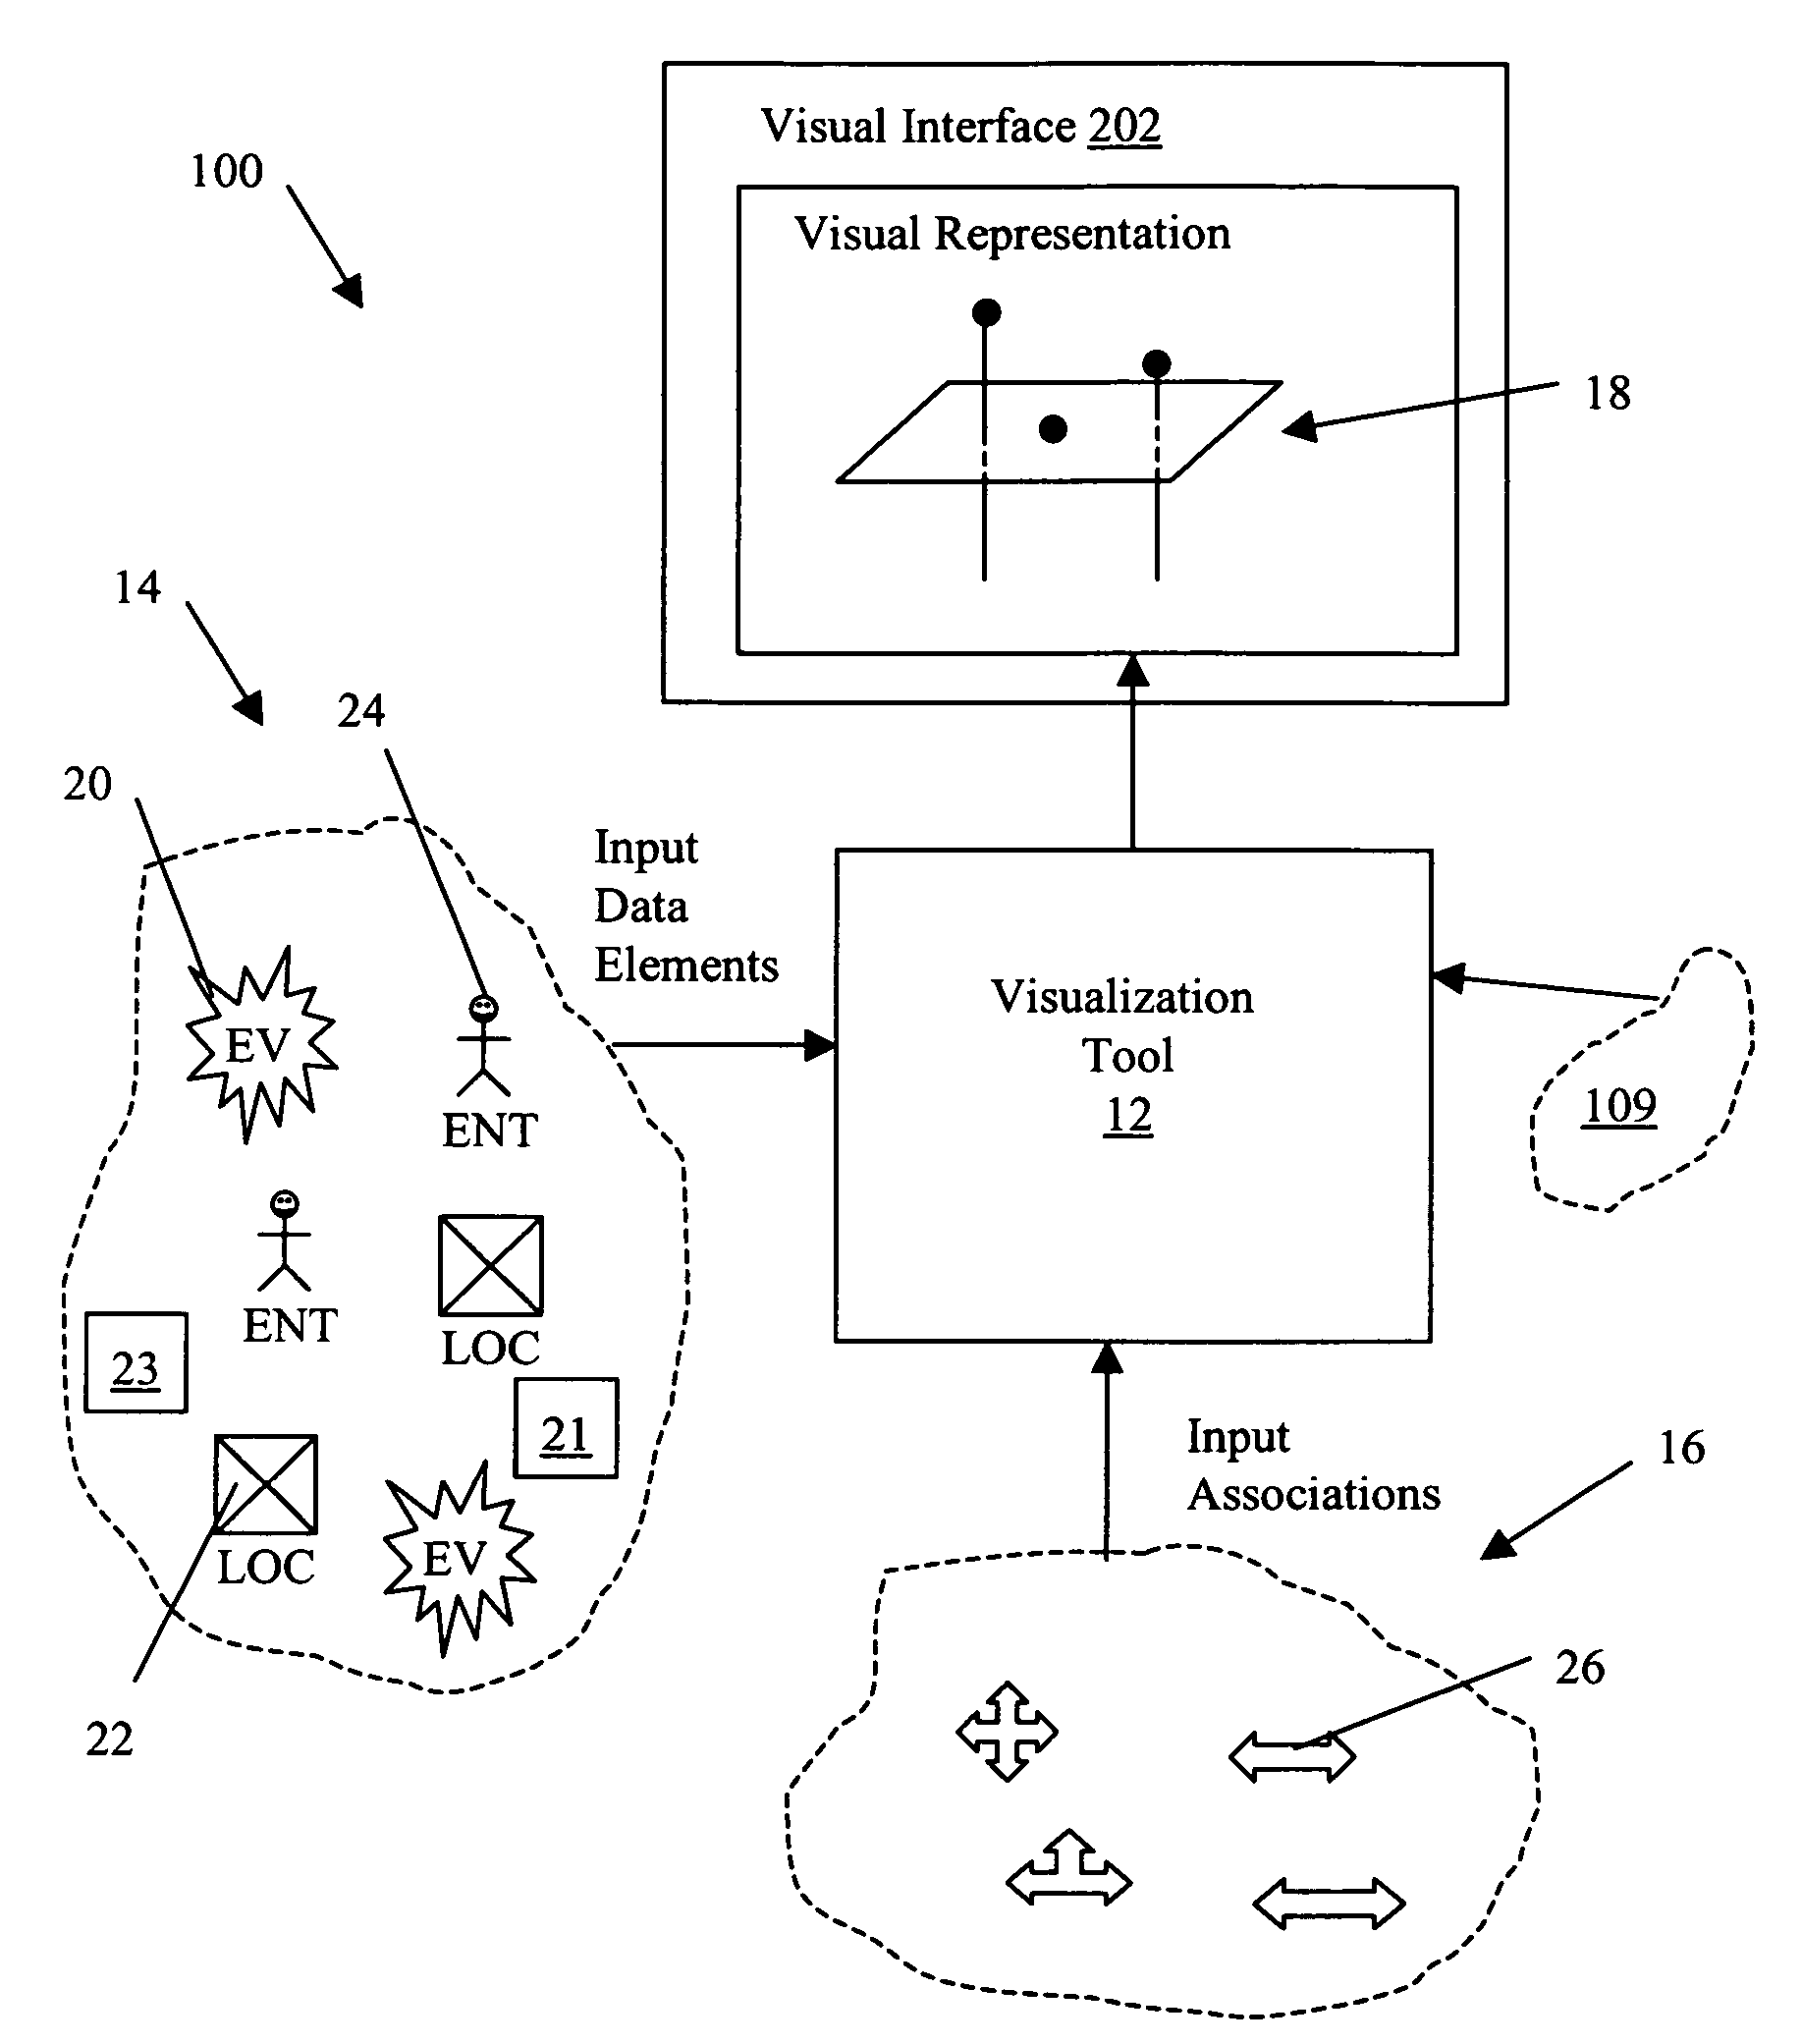
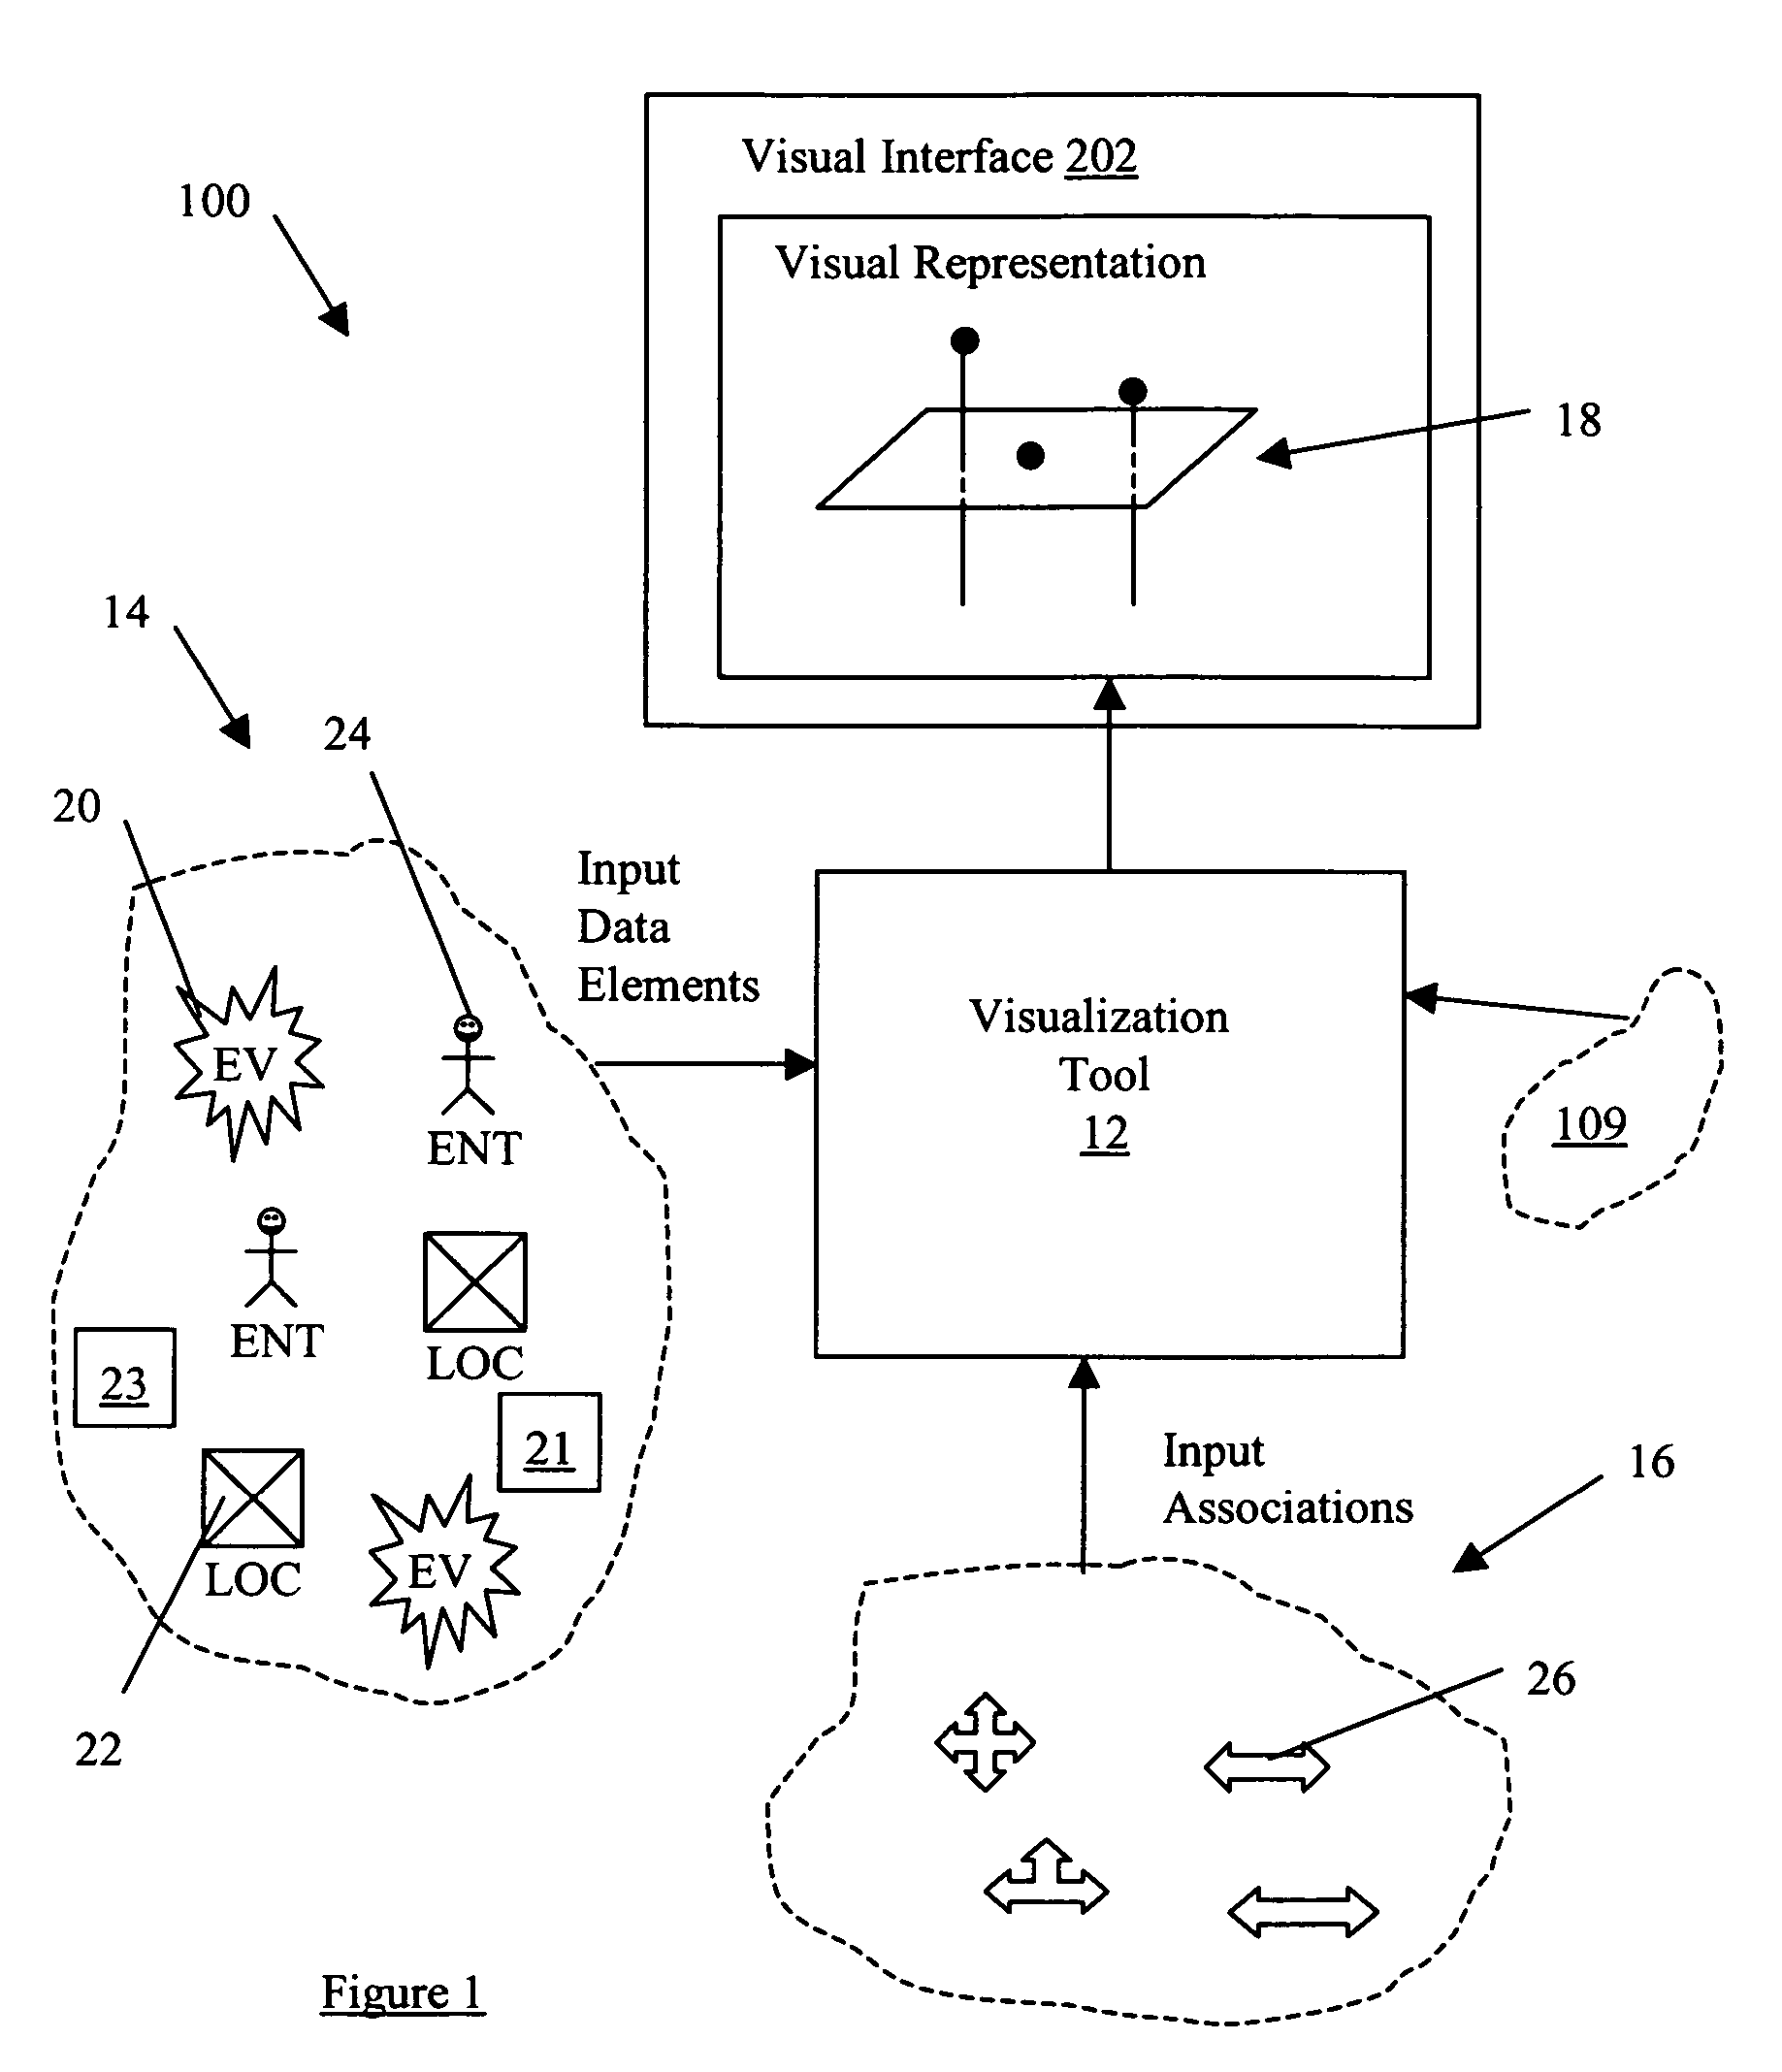
[0090] In the visualization tool 12, specific combinations of associated data elements (objects 20, 22, 24 and associations 26) can be defined. These defined groups 27 are represented visually as visual elements 410 in specific ways to express various types of occurrences in the visual representation 18. The following are examples of how the groups 27 of associated data elements can be formed to express specific occurrences and relationships shown as the connection visual elements 412.

[0091] Referring to FIGS. 6 and 7, example groups 27 (denoting common real world occurrences) are shown with selected subsets of the objects 20, 22, 24 combined via selected associations 26. The corresponding visualization representation 18 is shown as well including the temporal domain 402, the spatial domain 400, connection visual elements 412 and the visual elements 410 representing the event / entity / location combinations. It is noted that example applications ...


PUM


Abstract

A system and method for analyzing a plurality of data elements having both temporal and spatial properties, where a first data element and a second data element of the plurality of data elements are linked by at least one association element. The system and method include selecting the first data element from the plurality of data elements and providing at least one search criteria for use in analyzing the properties of the plurality of data elements with respect to at least one property of the first data element. An analysis module is used to apply the at least one search criteria to the properties of the plurality of data elements for identifying the second data element from the plurality of data elements and the corresponding at least one association element. The at least one association element is configured for representing a connection between the first data element and the second data element, such that the connection has a first property common to a property of the first data element and a second property common to a property of the second data element. A visualization module is used to generate a visual representation of the first and second data elements and the association element configured for display on a user interface for subsequent interaction with user events. The visual representation includes a spatial domain including a reference surface for providing a spatial reference frame having at least two spatial dimensions and a temporal domain operatively coupled to the spatial domain for providing a common temporal reference frame for locations of interest in the spatial domain.

Description

[0001] (This application claims the benefit of U.S. Provisional Application No. 60 / 707,942, filed Aug. 15, 2005, hereby incorporated by reference.)BACKGROUND OF THE INVENTION [0002] The present invention relates to an interactive visual presentation of multidimensional data on a user interface. [0003] Tracking and analyzing entities and streams of events, has traditionally been the domain of investigators, whether that be national intelligence analysts, police services or military intelligence. Business users also analyze events in time and location to better understand phenomenon such as customer behavior or transportation patterns. As data about events and objects become more commonly available, analyzing and understanding of interrelated temporal and spatial information is increasingly a concern for military commanders, intelligence analysts and business analysts. Localized cultures, characters, organizations and their behaviors play an important part in planning and mission exec...

Claims


Application Information

Patent Timeline
Patent Type & Authority Applications(United States)
IPC IPC(8): G06F15/16
CPCG06T11/206H04L41/0233H04L41/12H04L67/22H04L43/0811H04L67/36H04L41/22H04L67/535H04L67/75
Inventor WRIGHT, WILLIAMKAPLER, THOMAS
Owner PEN LINK LTD
Why Eureka
Try Eureka