Method, system, and program product for graphically representing a marketing optimization

a marketing optimization and graphic technology, applied in the field of marketing optimization, can solve the problems of general impracticality and inability of the industry to improve the average response rate to direct marketing

Inactive Publication Date: 2007-07-26
IBM CORP
View PDF15 Cites 27 Cited by
  • Summary
  • Abstract
  • Description
  • Claims
  • Application Information

AI Technical Summary

Problems solved by technology

While these efforts have helped reduce the negative impact of the changing marketing atmosphere, the industry has not been able to improv

Method used


Image

  • Method, system, and program product for graphically representing a marketing optimization
  • Method, system, and program product for graphically representing a marketing optimization
  • Method, system, and program product for graphically representing a marketing optimization

Examples


Embodiment Construction

[0028] As indicated above, the invention provides a method, system, and program product for graphically representing a marketing optimization.

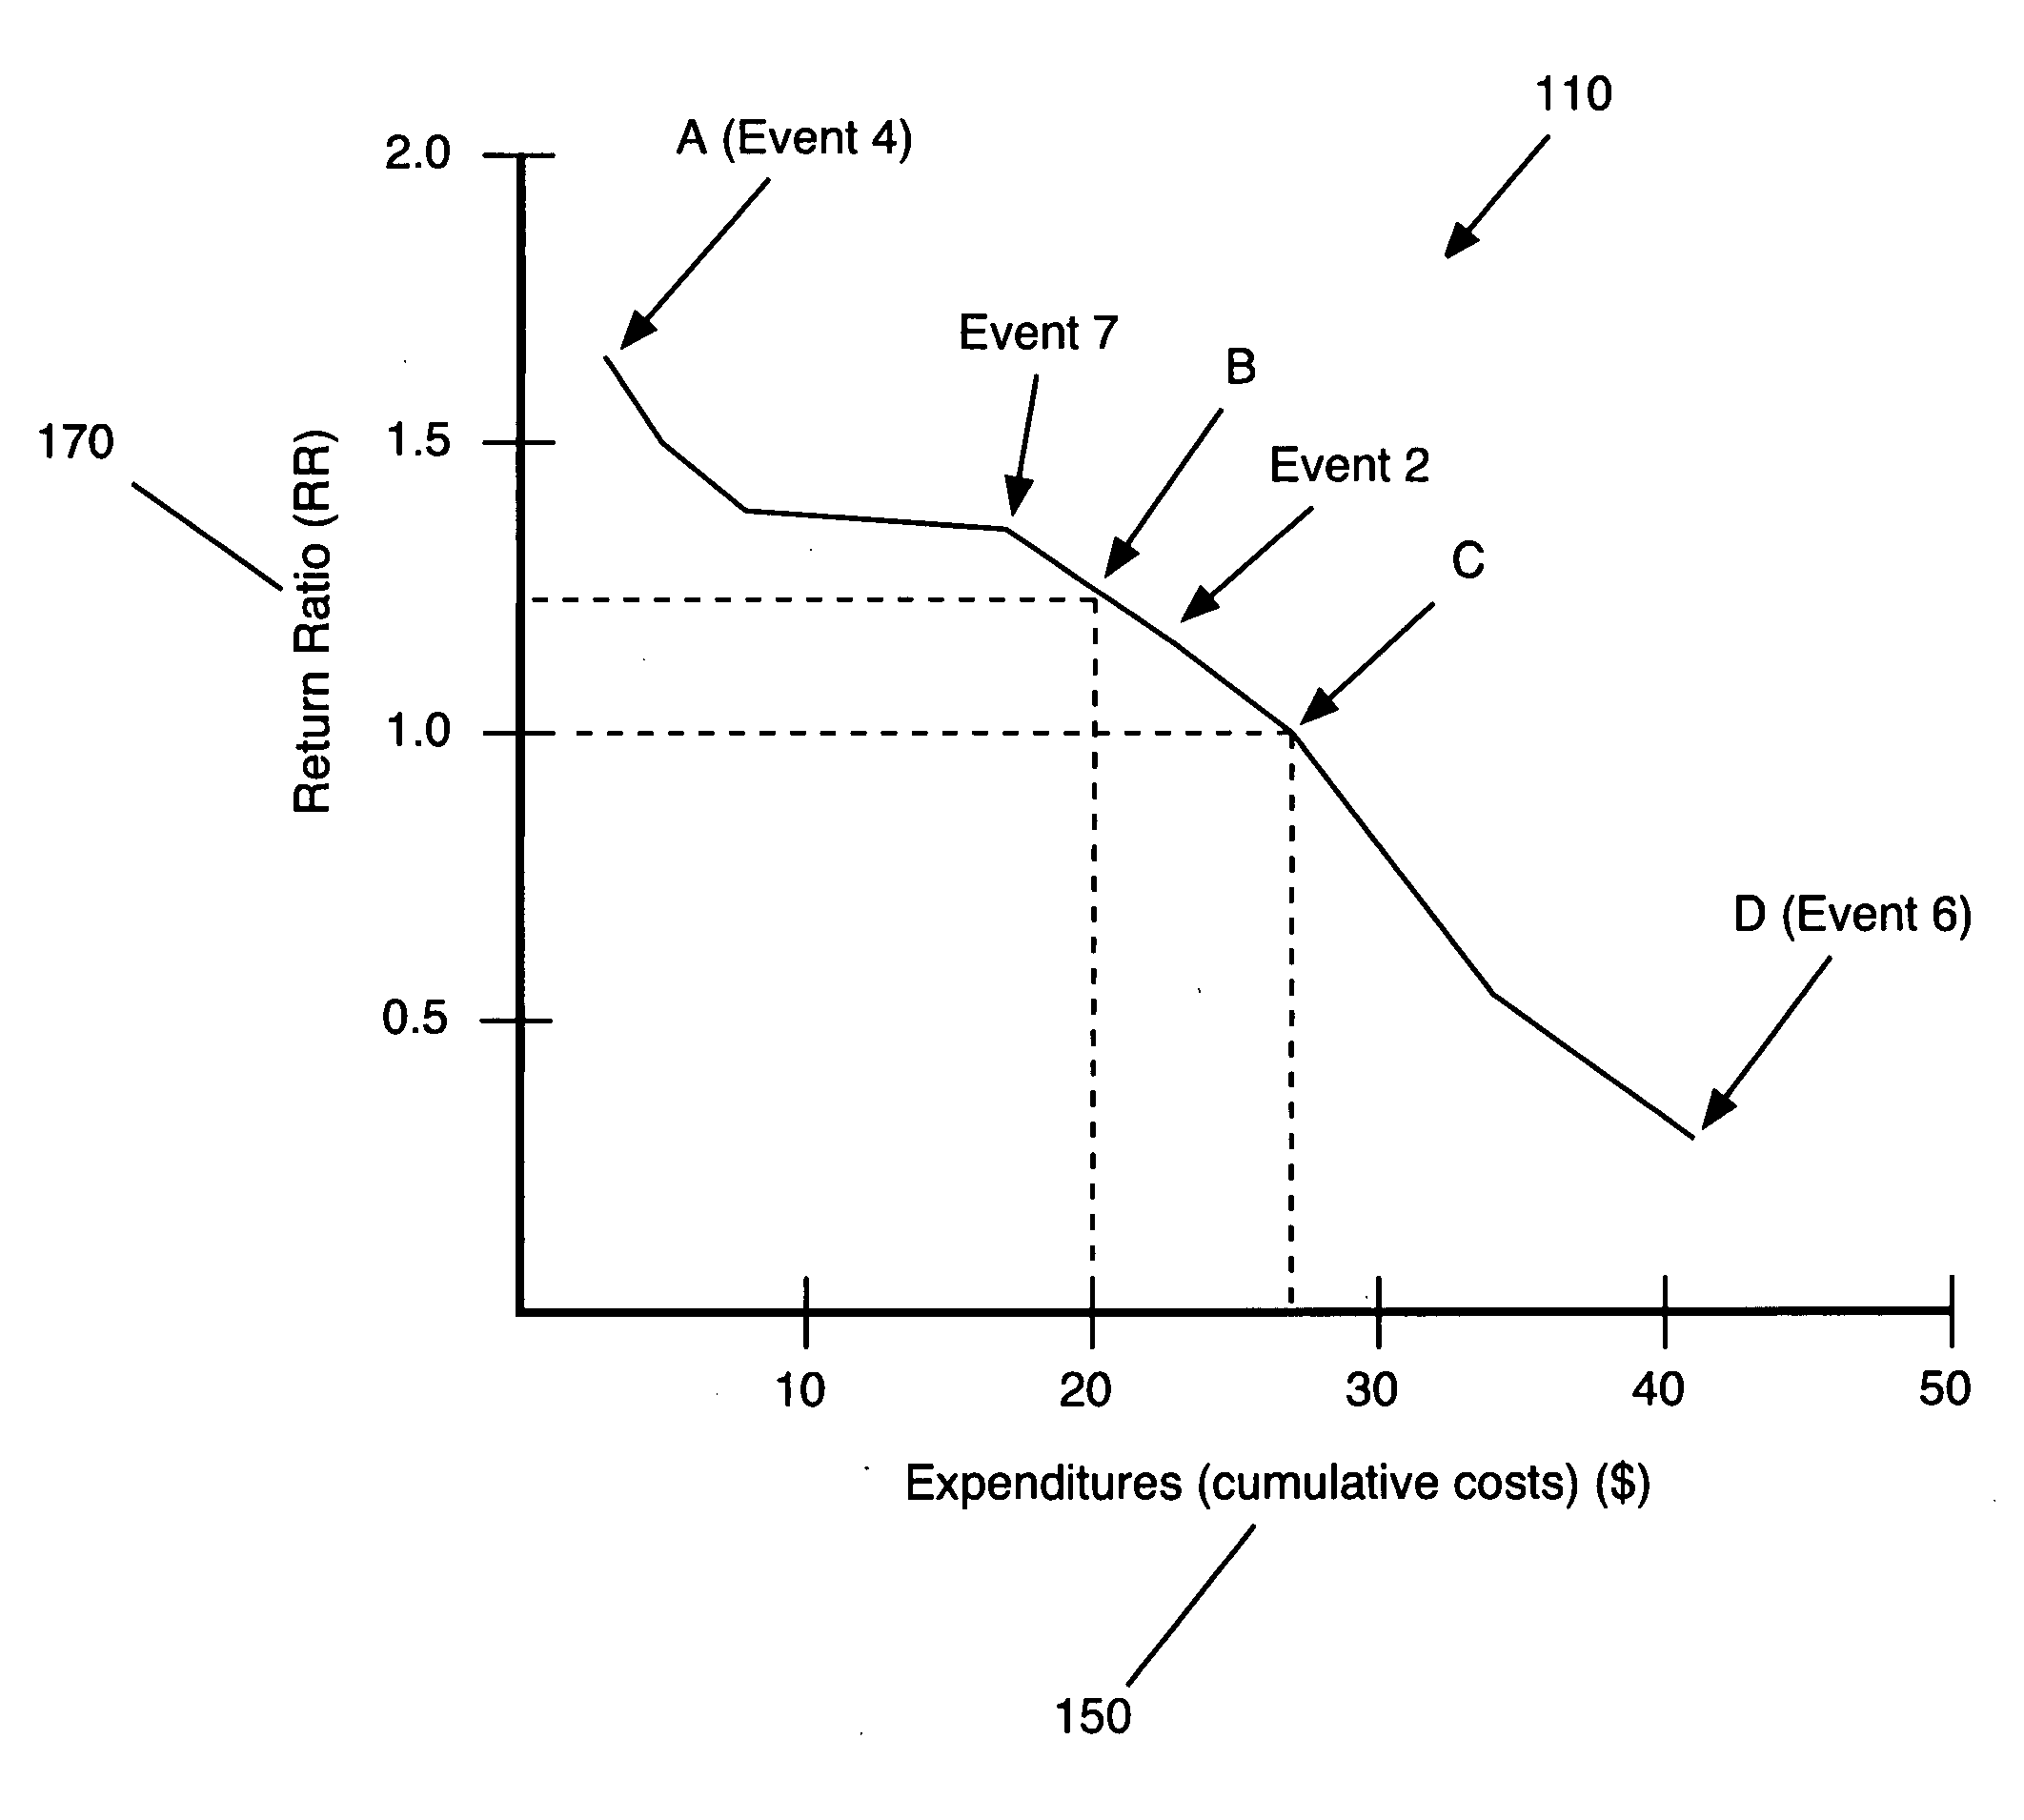
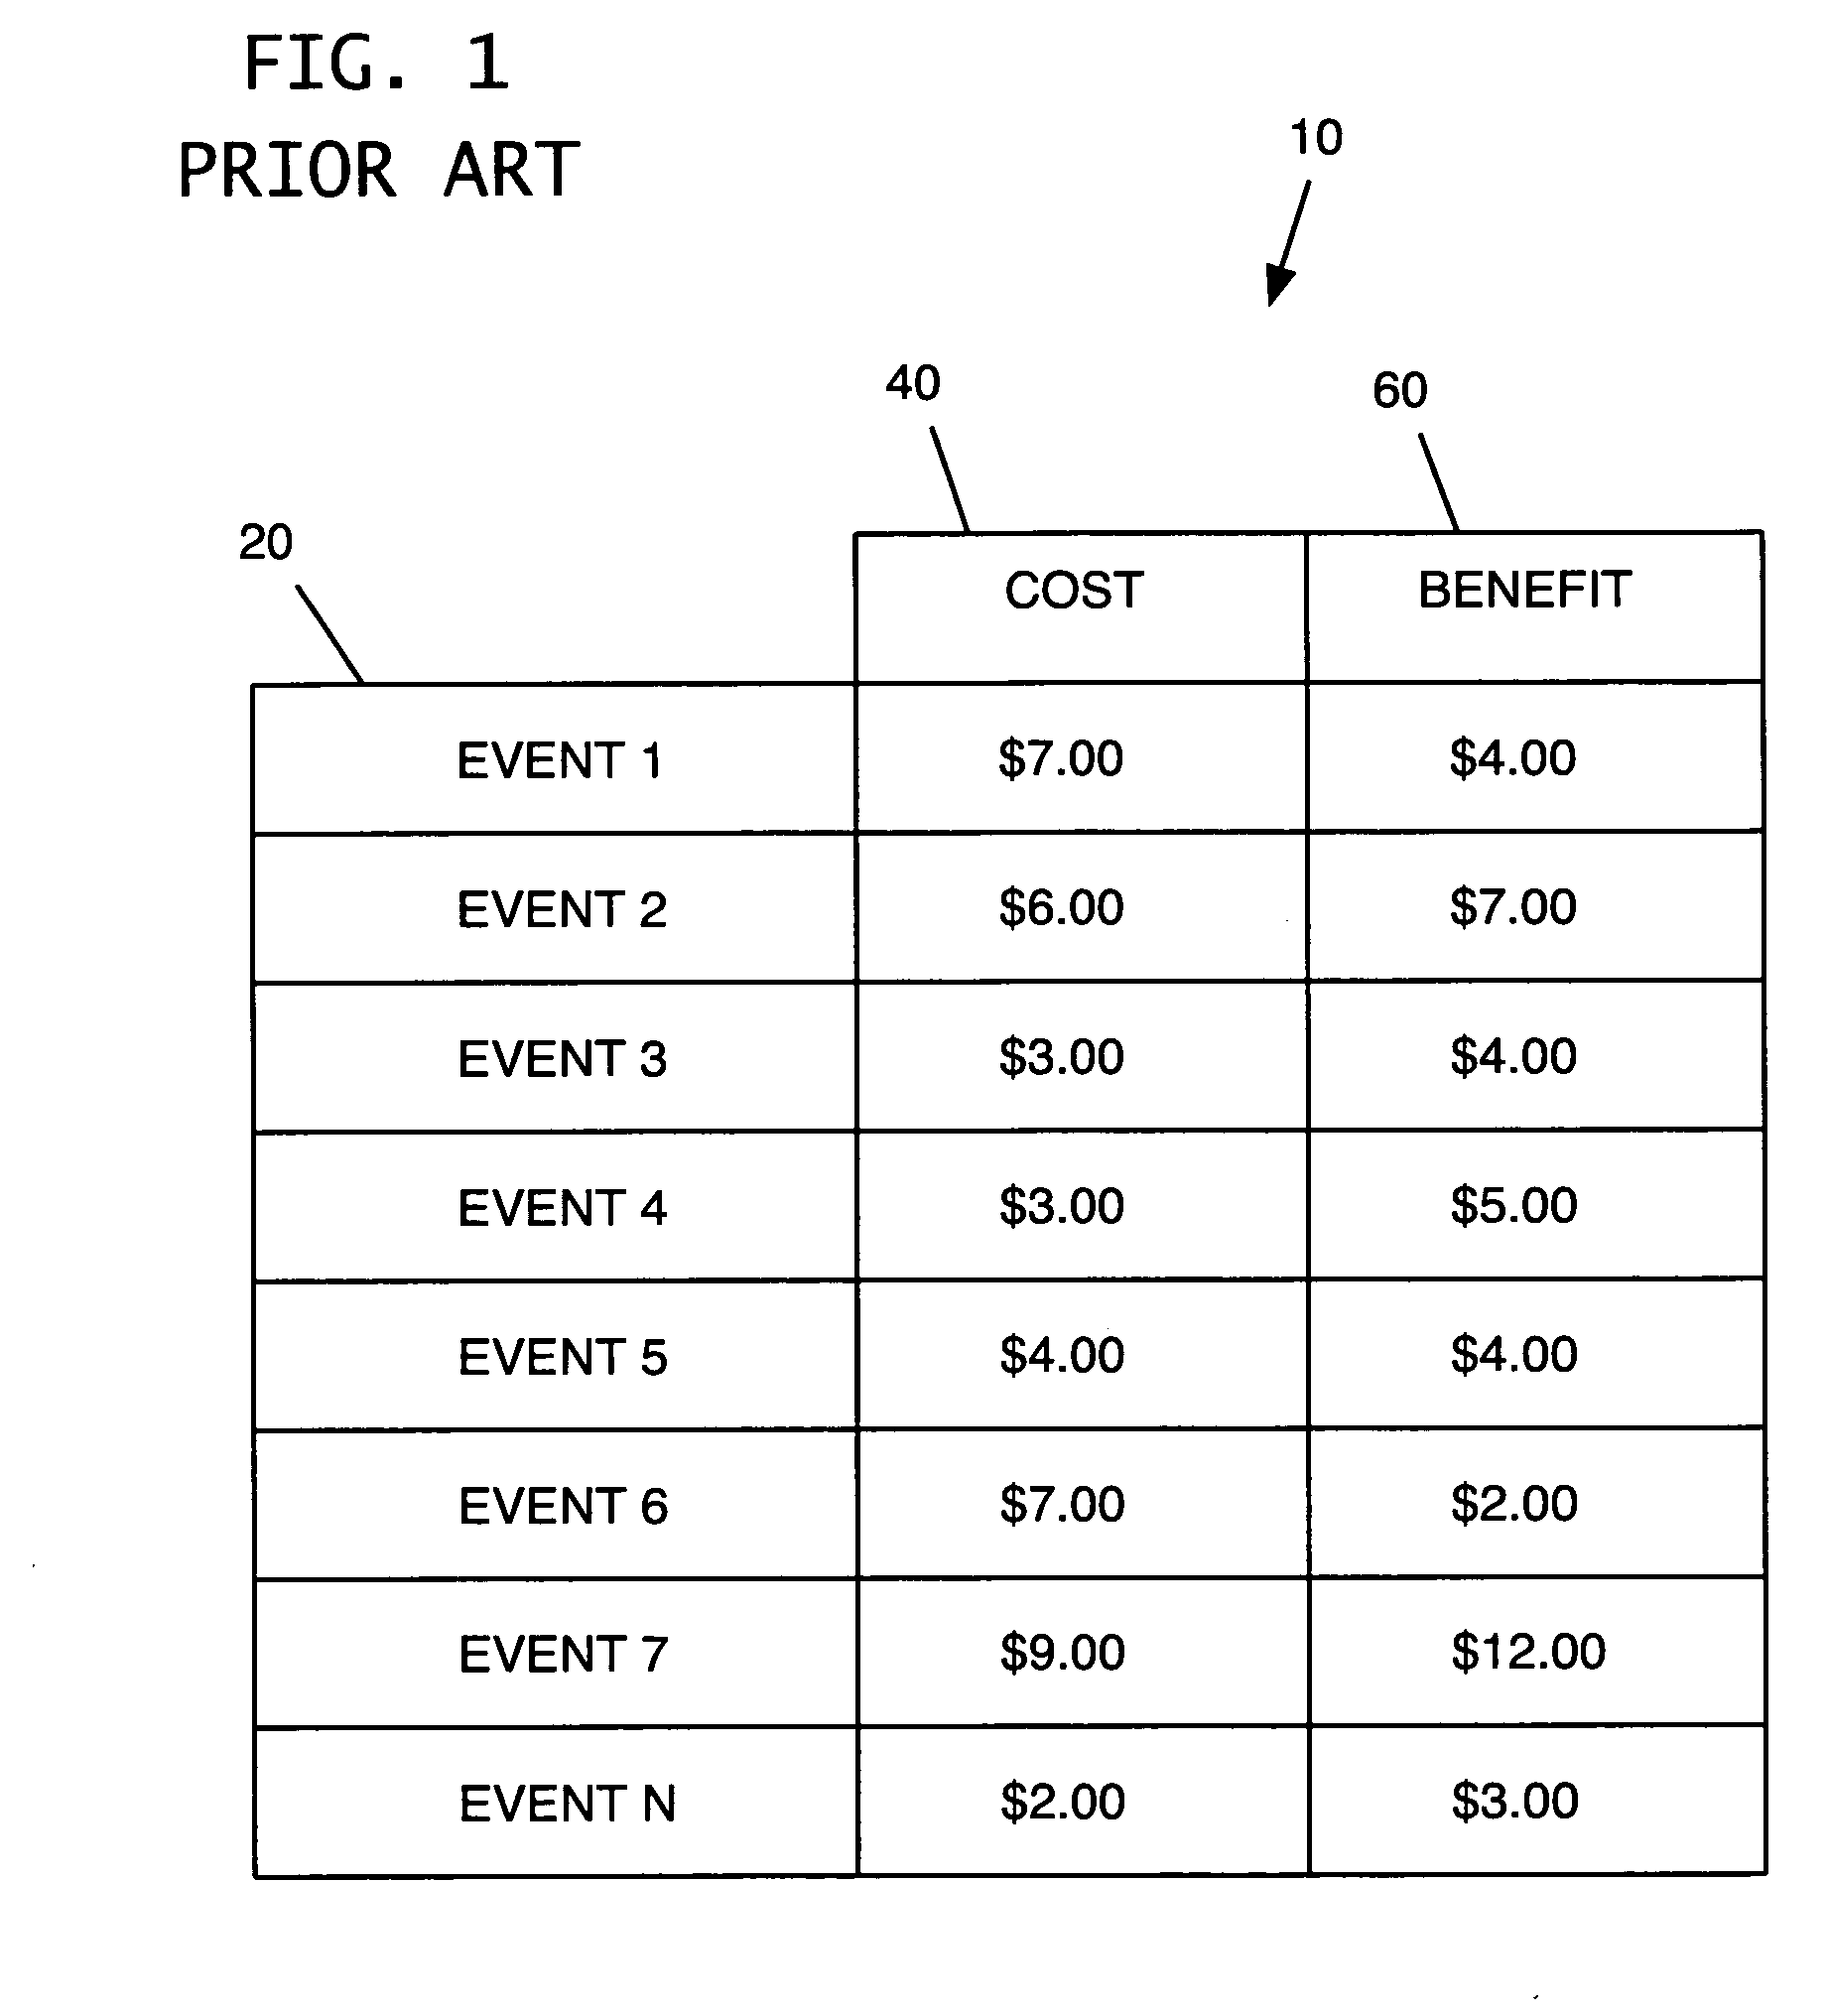
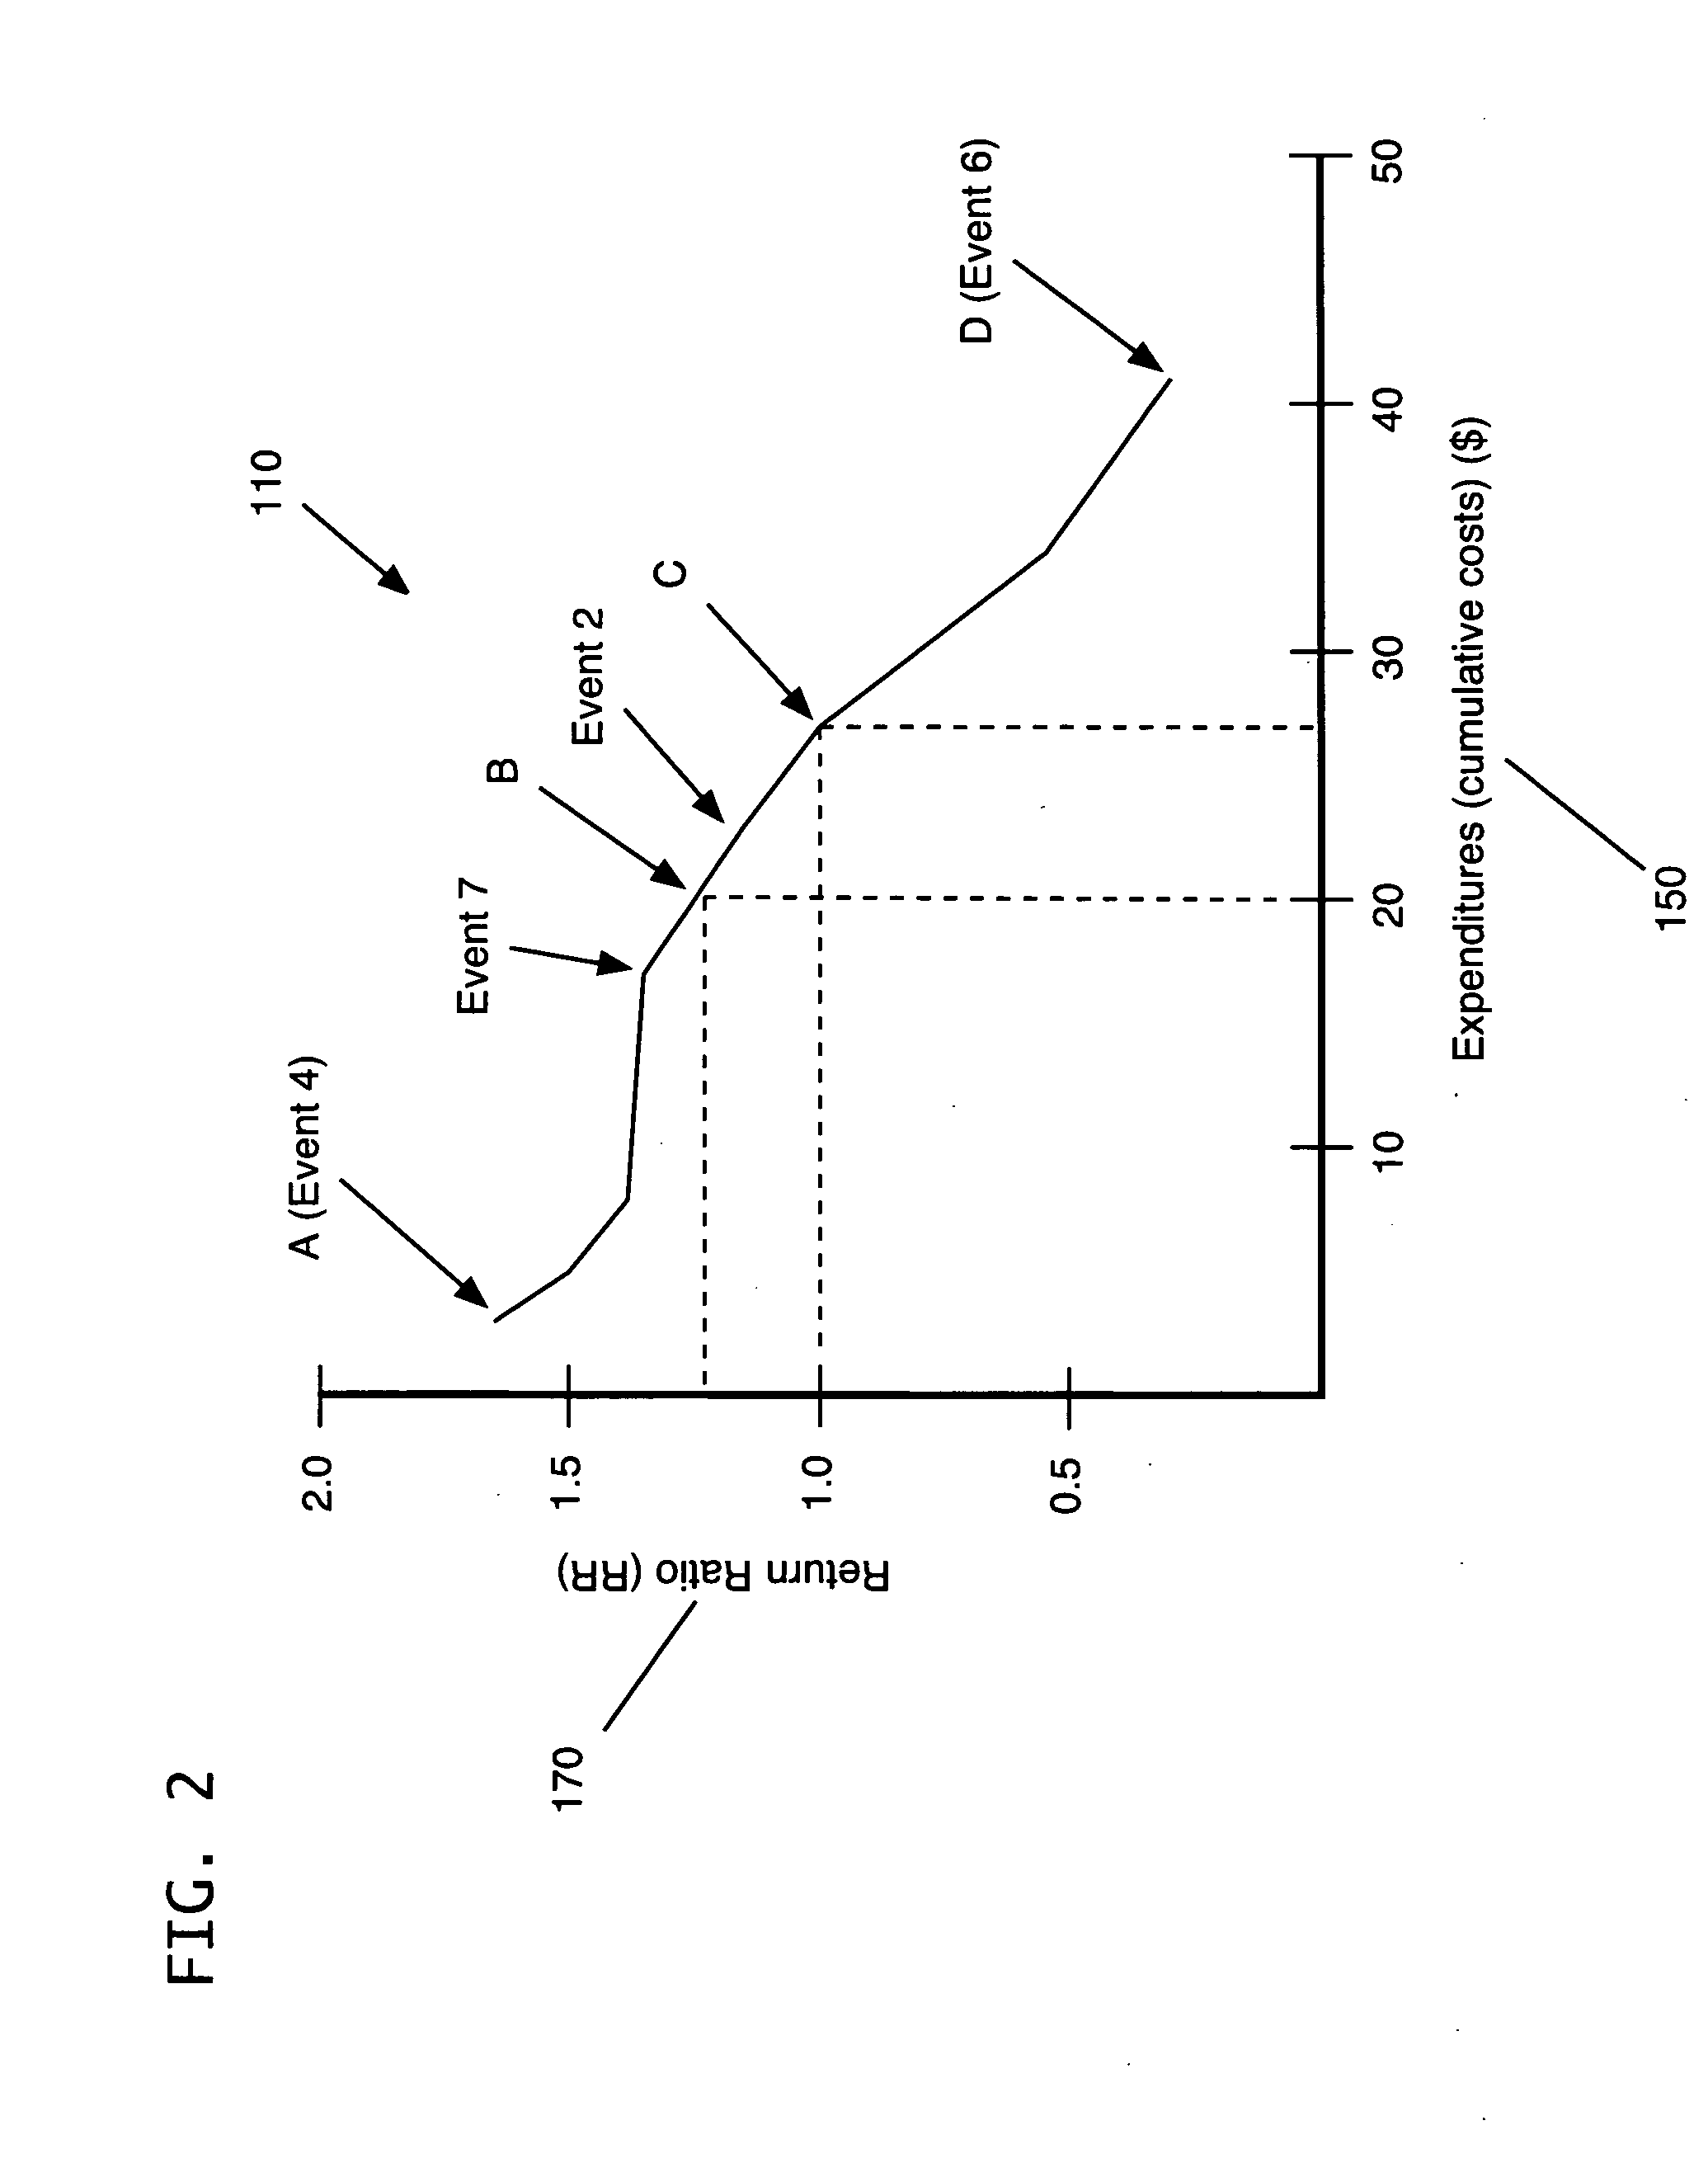
[0029] Referring now to FIG. 2, a graphical display 110 of the data of table 10 (FIG. 1) is shown, according to an embodiment of the invention. Graphical display 110 plots the calculated return ratio (RR) of each promotion event against total expenditures (i.e., cumulative costs 40 (FIG. 1)). For example, considering all eight events in table 10, point A represents the highest RR of the plurality of events 20 (FIG. 1), i.e., Event 4, having an RR of 1.67. Similarly, point D represents the lowest RR of the plurality of events 20, i.e., Event 6, having an RR of 0.286. To maximize the total benefit, promotion events are chosen in decreasing order of RR, as described above.

[0030] Graphical display 110 provides much more usable information than table 10, and presents the data in an easily-understandable and more useful form. For example, a user m...


PUM


Abstract

The invention provides a method, system, and program product for graphically representing a marketing optimization. In one embodiment, the method includes: selecting from a plurality of promotion events a promotion event having the highest return ratio (RR); graphically displaying the RR of the selected promotion event as a function of a cumulative cost of all selected promotion events; and repeating the selecting and graphically displaying steps from among unselected promotion events.

Description

BACKGROUND OF THE INVENTION [0001] 1. Technical Field [0002] The invention relates generally to marketing optimization, and more particularly, to a method, system, and program product for graphically representing a marketing optimization. [0003] 2. Background Art [0004] Direct marketing involves advertising to customers at a location other than the point of sale. Catalogs, first-class mail, telemarketing, and e-mail are some examples of direct marketing techniques that are currently utilized to promote the sale of goods or services. [0005] Increasingly, retail companies are adding direct marketing to their mix of marketing techniques. In addition, with the explosion of the Internet and e-commerce, consumers are presented with increasingly attractive alternatives to mail for the direct purchase of goods and services in their homes. [0006] In response to these changes, direct marketers have responded in a variety of ways. Many direct marketers have improved their targeting of recipien...

Claims


Application Information

Patent Timeline
IPC IPC(8): G06Q30/00
CPCG06Q30/0273G06Q30/00
Inventor RAMSEY, MARK S.SELBY, DAVID A.TODD, STEPHEN J.
Owner IBM CORP
Why Eureka
Try Eureka