
Graphics image generation and data analysis

Inactive Publication Date: 2007-08-09
IBM CORP
View PDF9 Cites 69 Cited by
  • Summary
  • Abstract
  • Description
  • Claims
  • Application Information

AI Technical Summary

Benefits of technology

[0028] In light of these problems, an aspect of the present invention is to provide a graphics display system and method for effectively presenting information obtained by data mining.
[0029] Another aspect of the present invention is to improve the visibility of the display of each individual data element and attributes of data included in a particular category while allowing an overview of whole large-scale hierarchical data to be provided.
[0033] Furthermore, according to the present invention, a graphics image can be output in which results of data analysis conducted based on a given aggregation or filtering criteria is properly reflected, therefore information obtained by data mining can effectively presented.

Problems solved by technology

However, if the size of a database analyzed is large, a difficulty arises in how information obtained should be presented to a user.
Most analysts analyze only the categories familiar to them because it is difficult for them to search the database to find nodes that contain insights of interest from among as many as 40,000 nodes or to investigate all nodes by following related nodes.
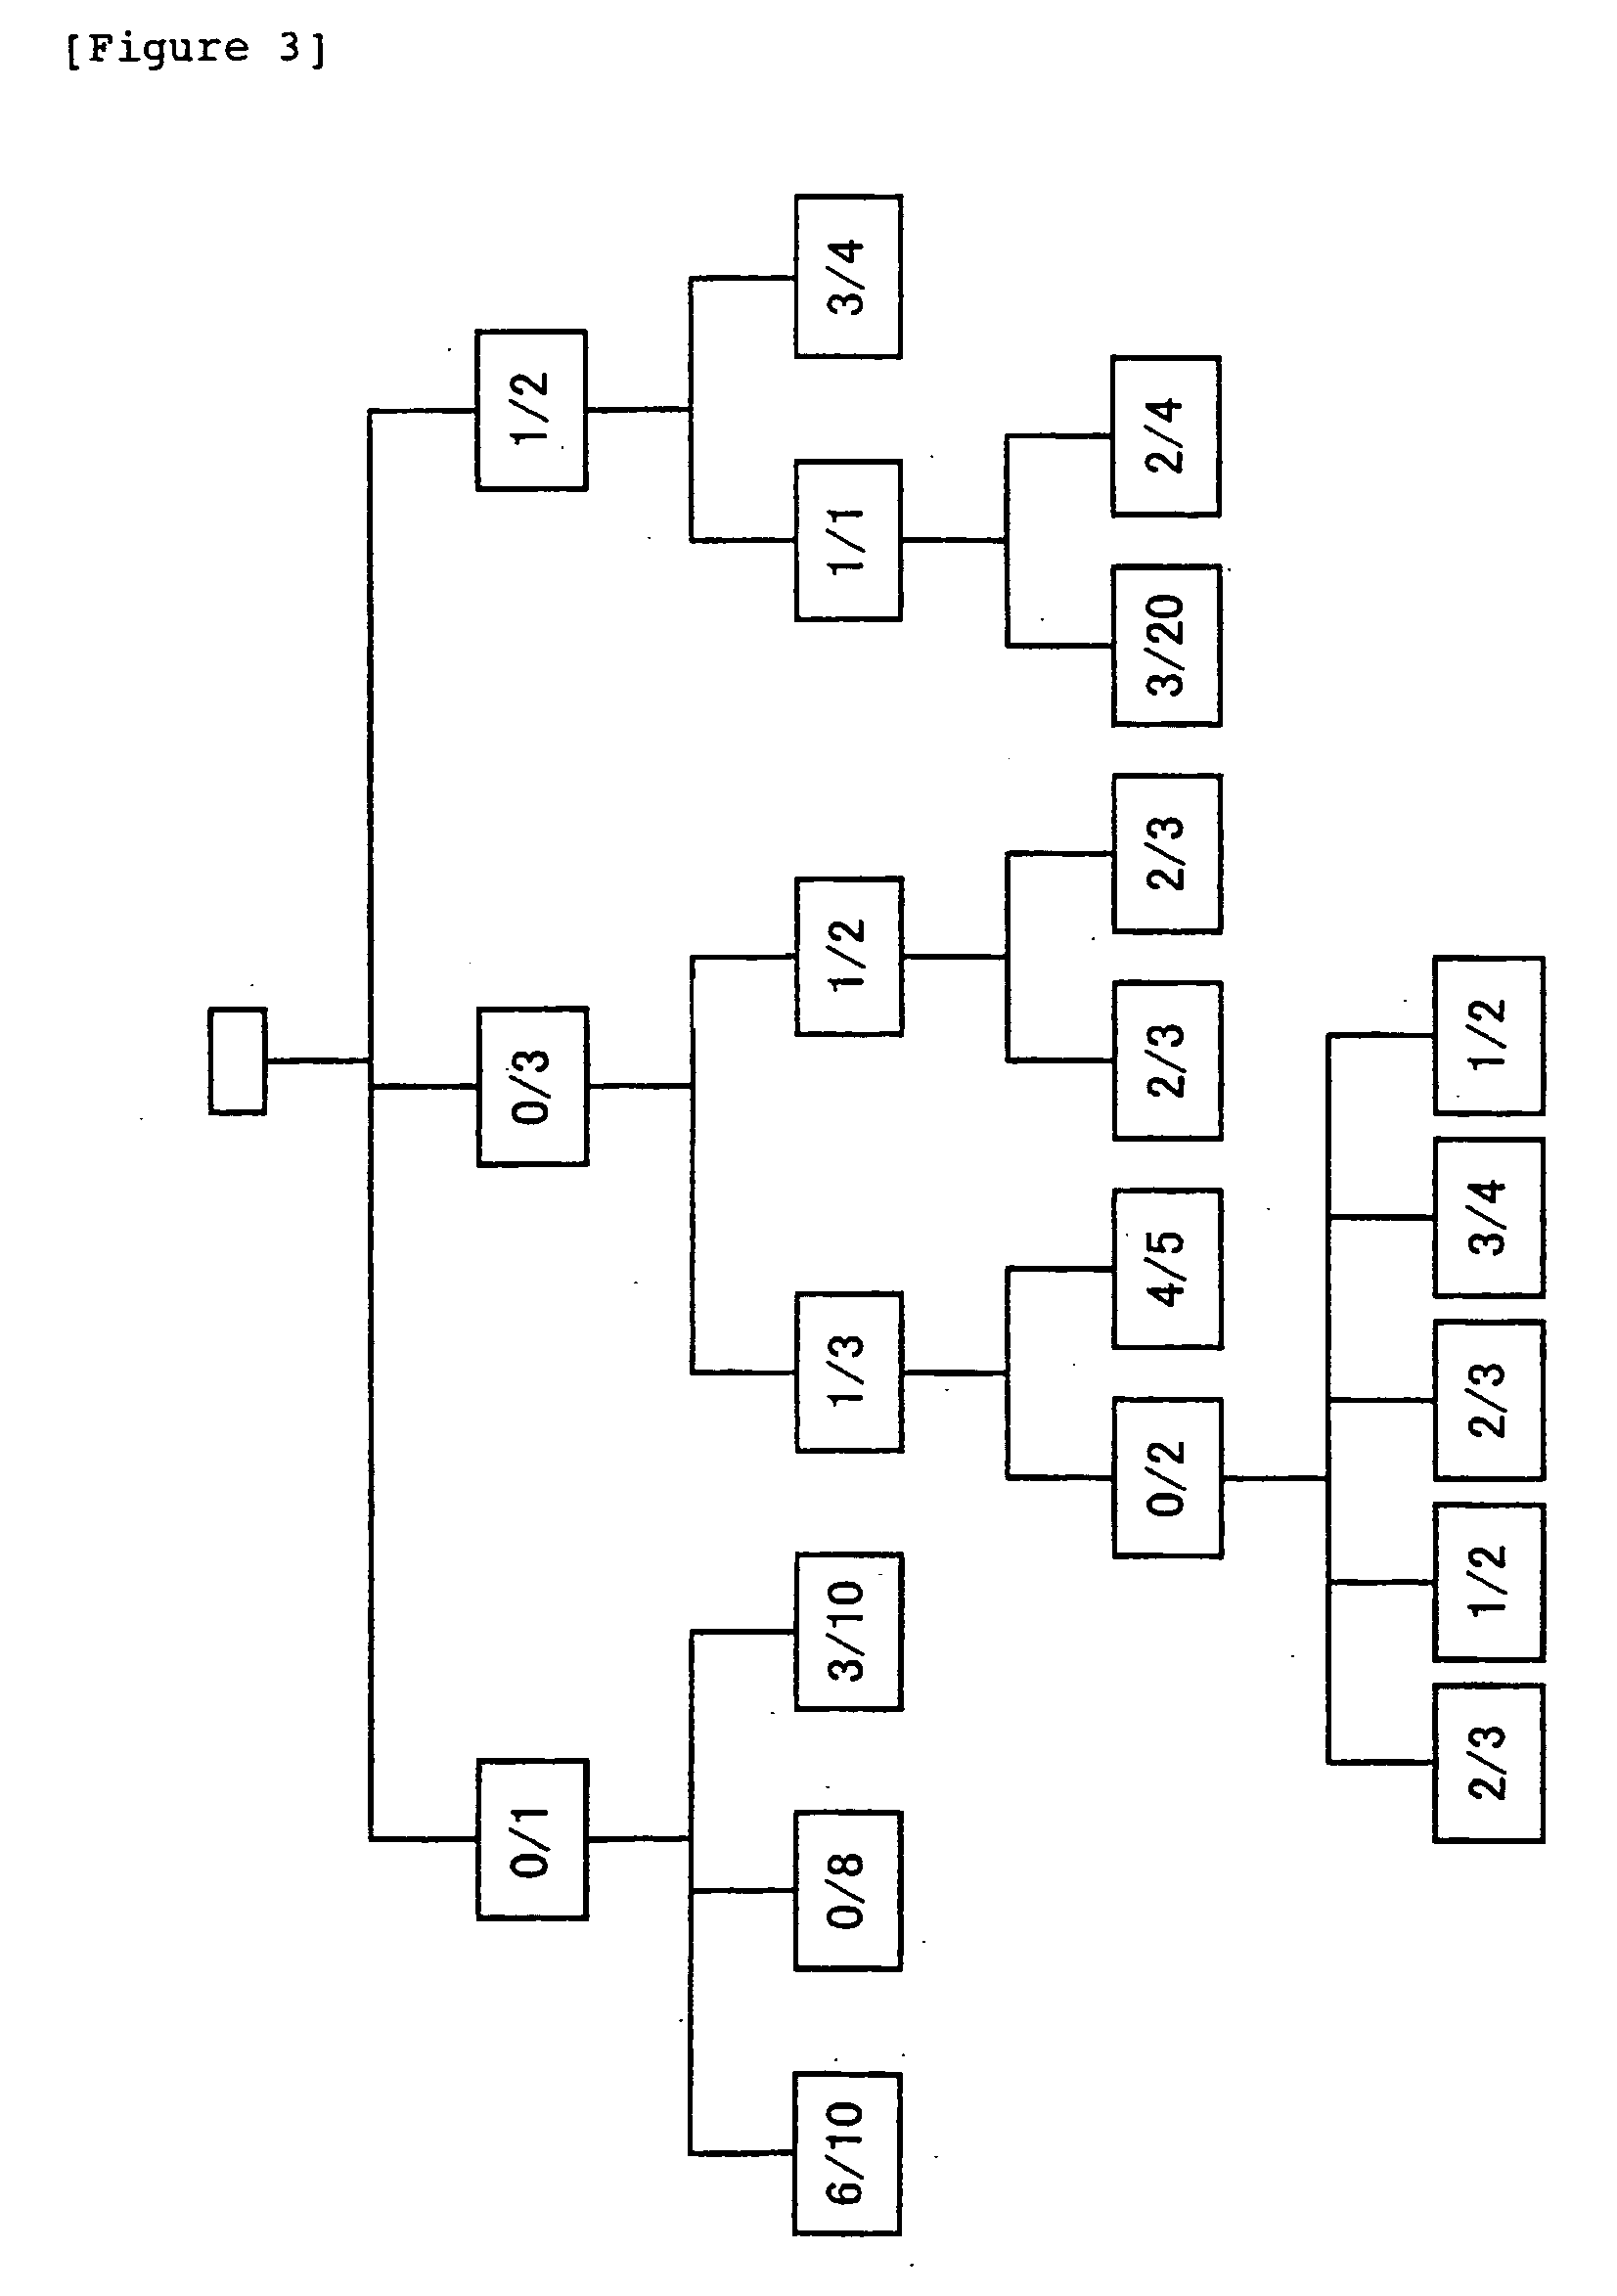
However, the output is not always easy to look at if it displays all of thousands of tens of thousands data elements directly.
Therefore, it is difficult to display thousands or tens of thousands data elements.
However, when thousands or tens of thousands data elements were displayed, a unit display area mapped to each data element would be so small that the visibility decreases.
However, if bars are displayed for thousands or tens of thousands data elements, the image is crowded with the bars, degrading the visibility.

Method used


Image

  • Graphics image generation and data analysis
  • Graphics image generation and data analysis
  • Graphics image generation and data analysis

Examples


Embodiment Construction

[0073] The present invention provides a graphics display apparatus, system and method for effectively presenting information obtained by data mining. It also improves the visibility of the display of each individual data element and attributes of data included in a particular category while allowing an overview of whole large-scale hierarchical data to be provided.

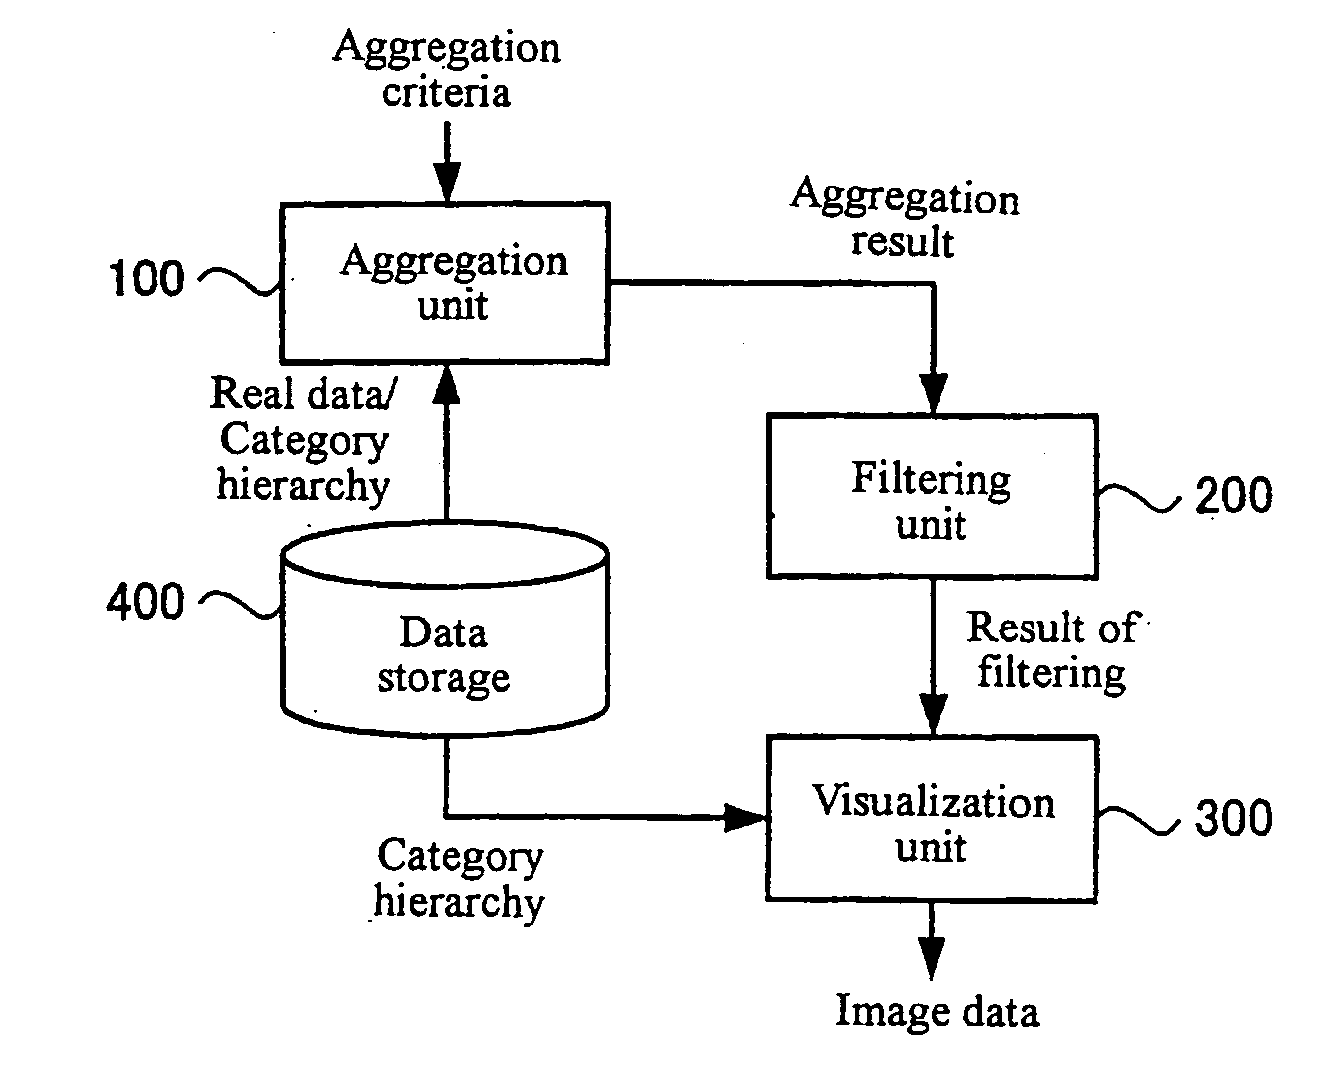
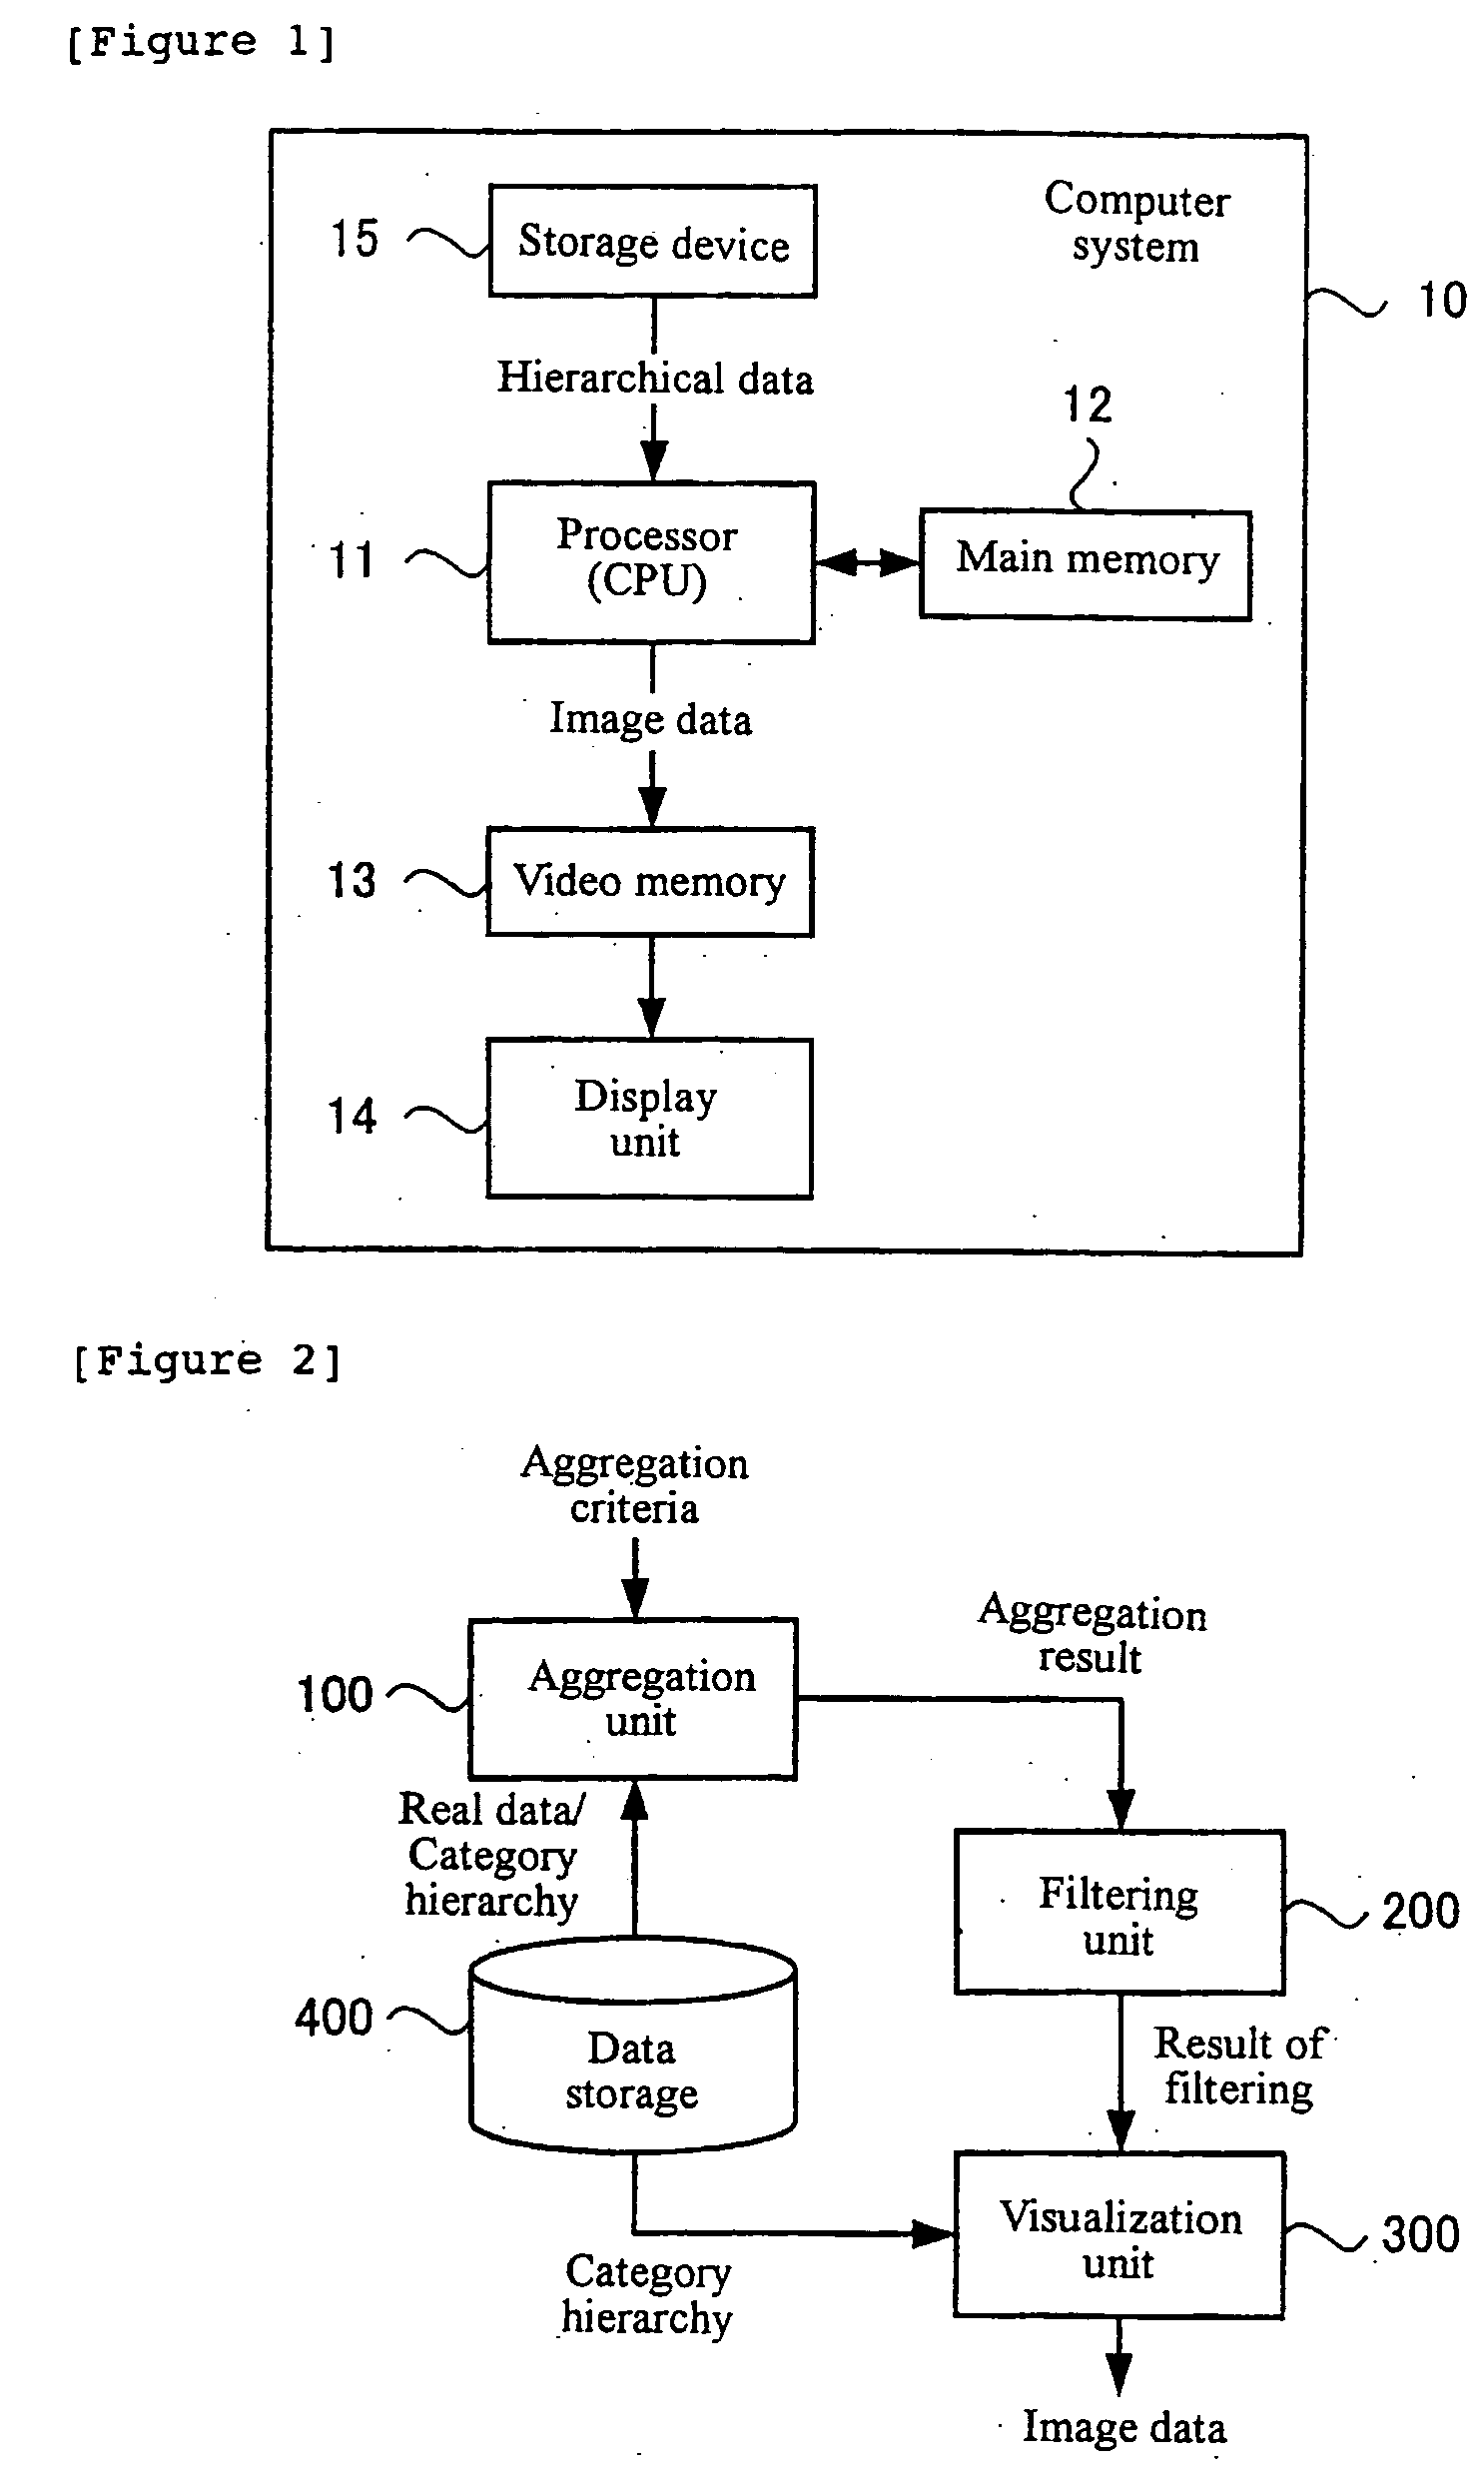
[0074] In an example embodiment, the present invention is implemented as a graphics image generation apparatus which visualizes a hierarchical structure of hierarchical data and presenting the visualized data and is configured as follows. The graphics image generation apparatus includes an aggregation unit for performing aggregation of attributes of nodes in the hierarchical data according to given aggregation criteria; a filtering unit for filtering the result of aggregation performed by the aggregation unit according to given filtering criteria to select nodes to be displayed from the hierarchical data; and a visualizat...


PUM


Abstract

Provides graphics display apparatus, systems and methods for effectively presenting information obtained by data mining, and to improve the visibility of the display of individual data elements and attributes of data included in a particular category while allowing an overview of whole large-scale hierarchical data to be provided. An example embodiment includes an aggregation unit for performing aggregation of attributes of nodes in the hierarchical data according to given aggregation criteria; a filtering unit for filtering the result of aggregation performed by the aggregation unit according to given filtering criteria to select nodes to be displayed from the hierarchical data; and a visualization unit for generating a graphics image that includes the nodes to be displayed selected by the filtering unit and reflects the hierarchical structure of the hierarchical data.

Description

FIELD OF THE INVENTION [0001] The present invention relates to a graphics display technique for generating a graphics image of hierarchical data. BACKGROUND ART [0002] With the widespread use of computer-based database system, various approaches to data mining systems for extracting desired information from vast amounts of data have been proposed. [0003] The following documents are considered: [0004] [Non-Patent Document 1][0005] Hirofumi Matsuzawa, Toru Nagano, Akiko Murakami, Hironobu Takeuchi, Koichi Takeda, and Yasushi Kanda, “MedTAKMI: A text mining system for databases of bio-medical document,” Workshop on data mining, Japan Society for Software Science and Technology, September 2000 [0006] [Non-Patent Document 2][0007] Hao M. C., Hsu M., DayalU., and Krug A., “Web-based Visualization of Large Hierarchical Graphs Using Invisible Links in a Hyperbolic Space,” HP Laboratories Palo Alto, HPL-2000-2 [0008] [Non-Patent Document 3][0009] Ben Shneiderman, “Treemaps for space-constrai...

Claims


Application Information

Patent Timeline
IPC IPC(8): G06F7/00G06F3/00G06F3/048G06F17/30G06F19/00
CPCG06F17/30958G06F16/9024
Inventor MATSUZAWA, HIROFUMINAGANO, TOHRUITOH, TAKAYUKIYAMAGUCHI, YUMI
Owner IBM CORP
Learn More