
Monitoring of Video or Audio Based on In-Band and Out-of-Band Data

Inactive Publication Date: 2007-11-29
DIGIMARC CORP +1
View PDF99 Cites 8 Cited by
  • Summary
  • Abstract
  • Description
  • Claims
  • Application Information

AI Technical Summary

Benefits of technology

[0004] Various methods have been developed to eliminate or limit both sophisticated and unsophisticated illegitimate distribution as well as to monitor distribution. Some of these methods rely on physical means. Others employ an auxiliary embedded signal to control, monitor and track usage of the content.
[0005] I

Problems solved by technology

The copying and redistribution of commercial imagery, audio and video productions has long been a cause of lost revenues to the creators / producers of such material.

Method used


Image

  • Monitoring of Video or Audio Based on In-Band and Out-of-Band Data
  • Monitoring of Video or Audio Based on In-Band and Out-of-Band Data
  • Monitoring of Video or Audio Based on In-Band and Out-of-Band Data

Examples


specific example

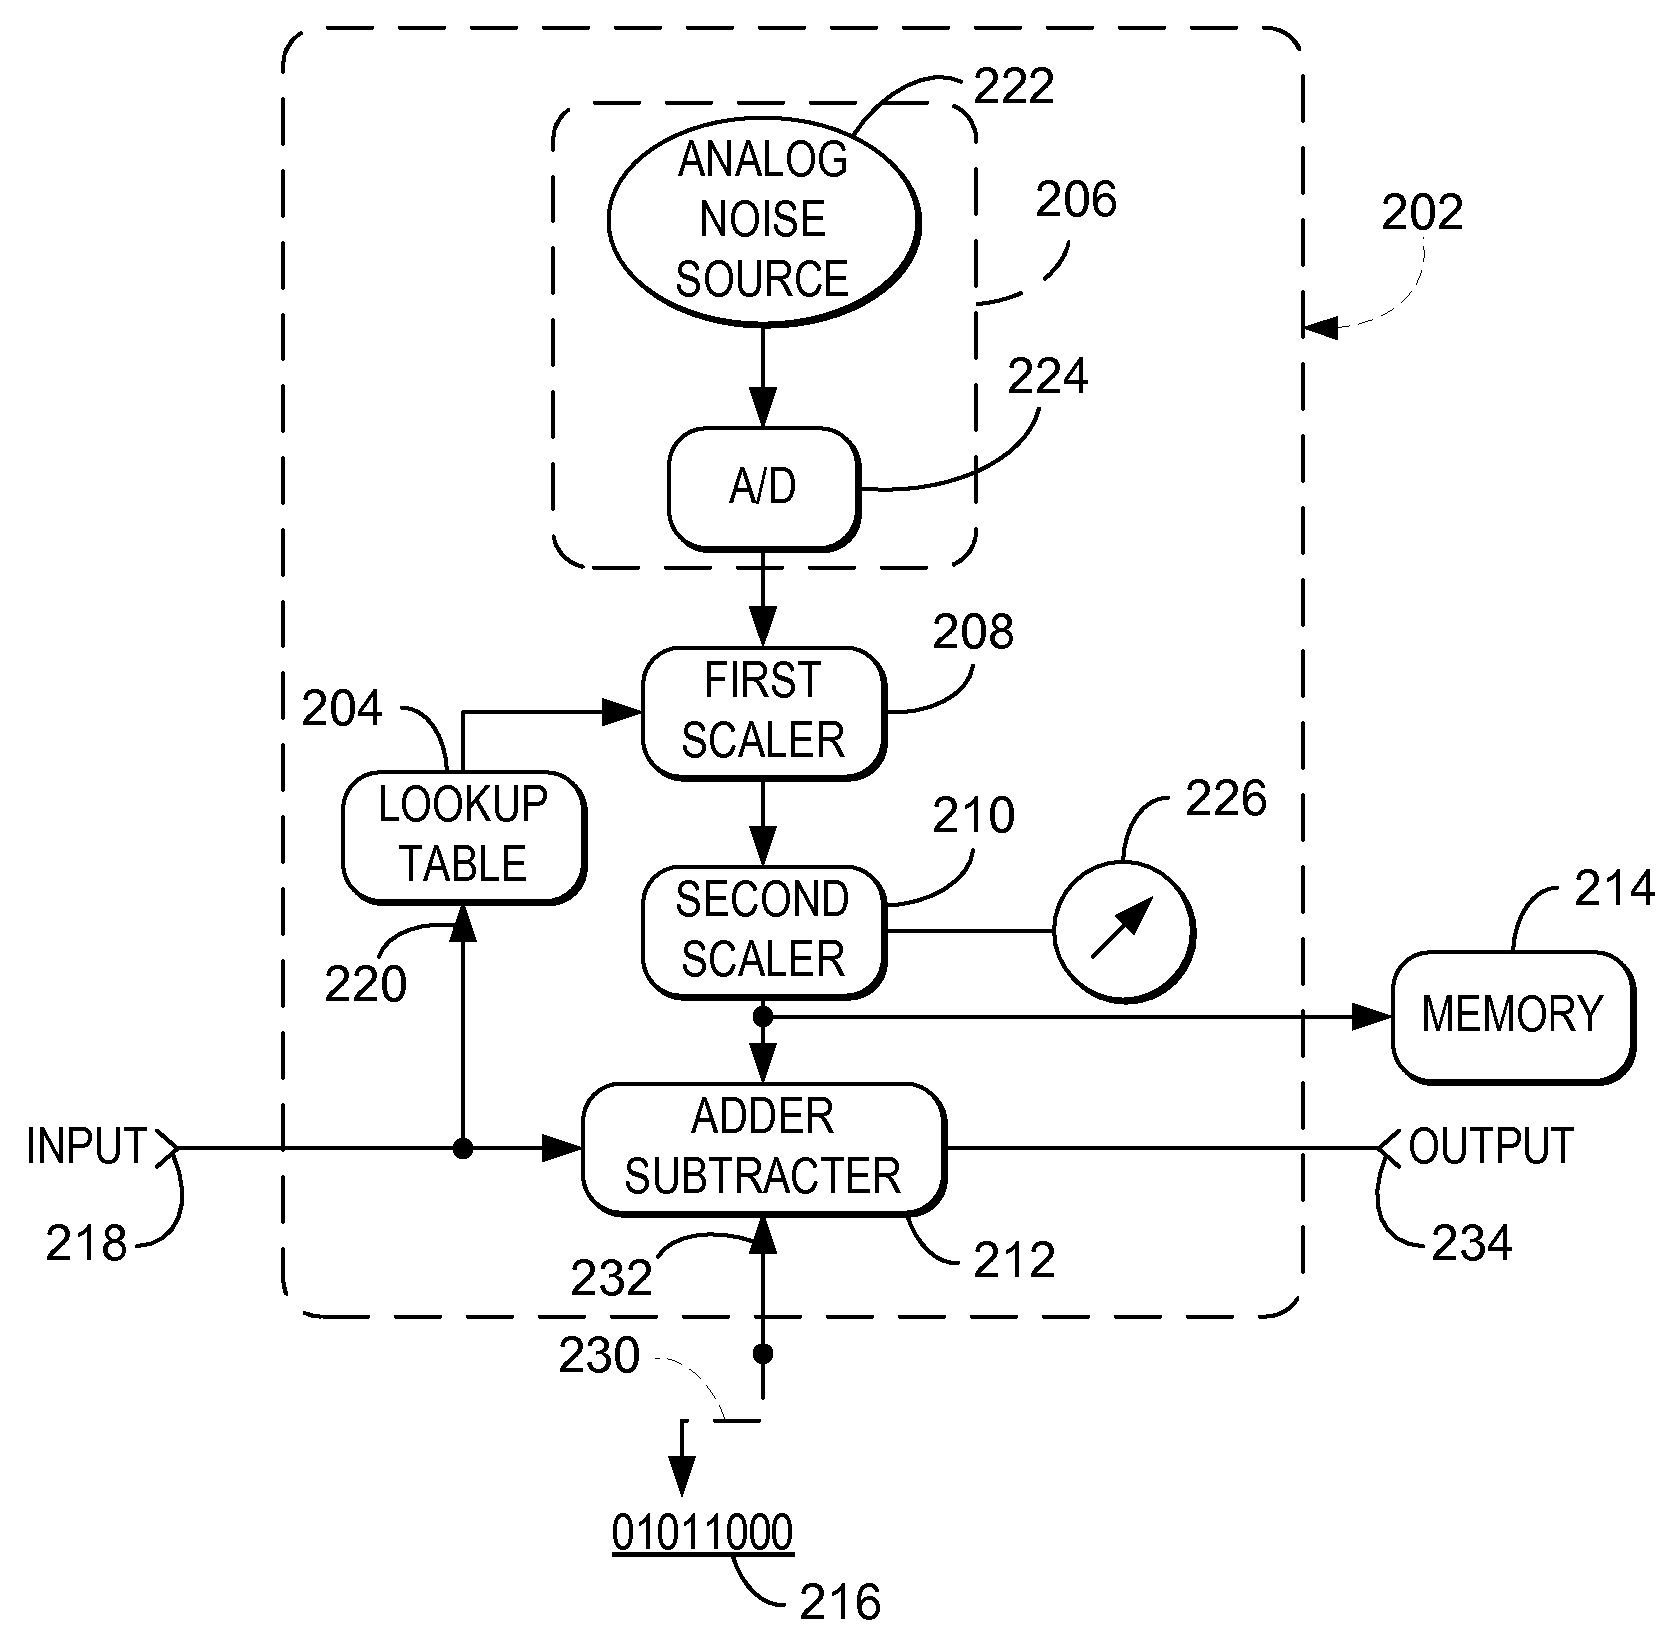
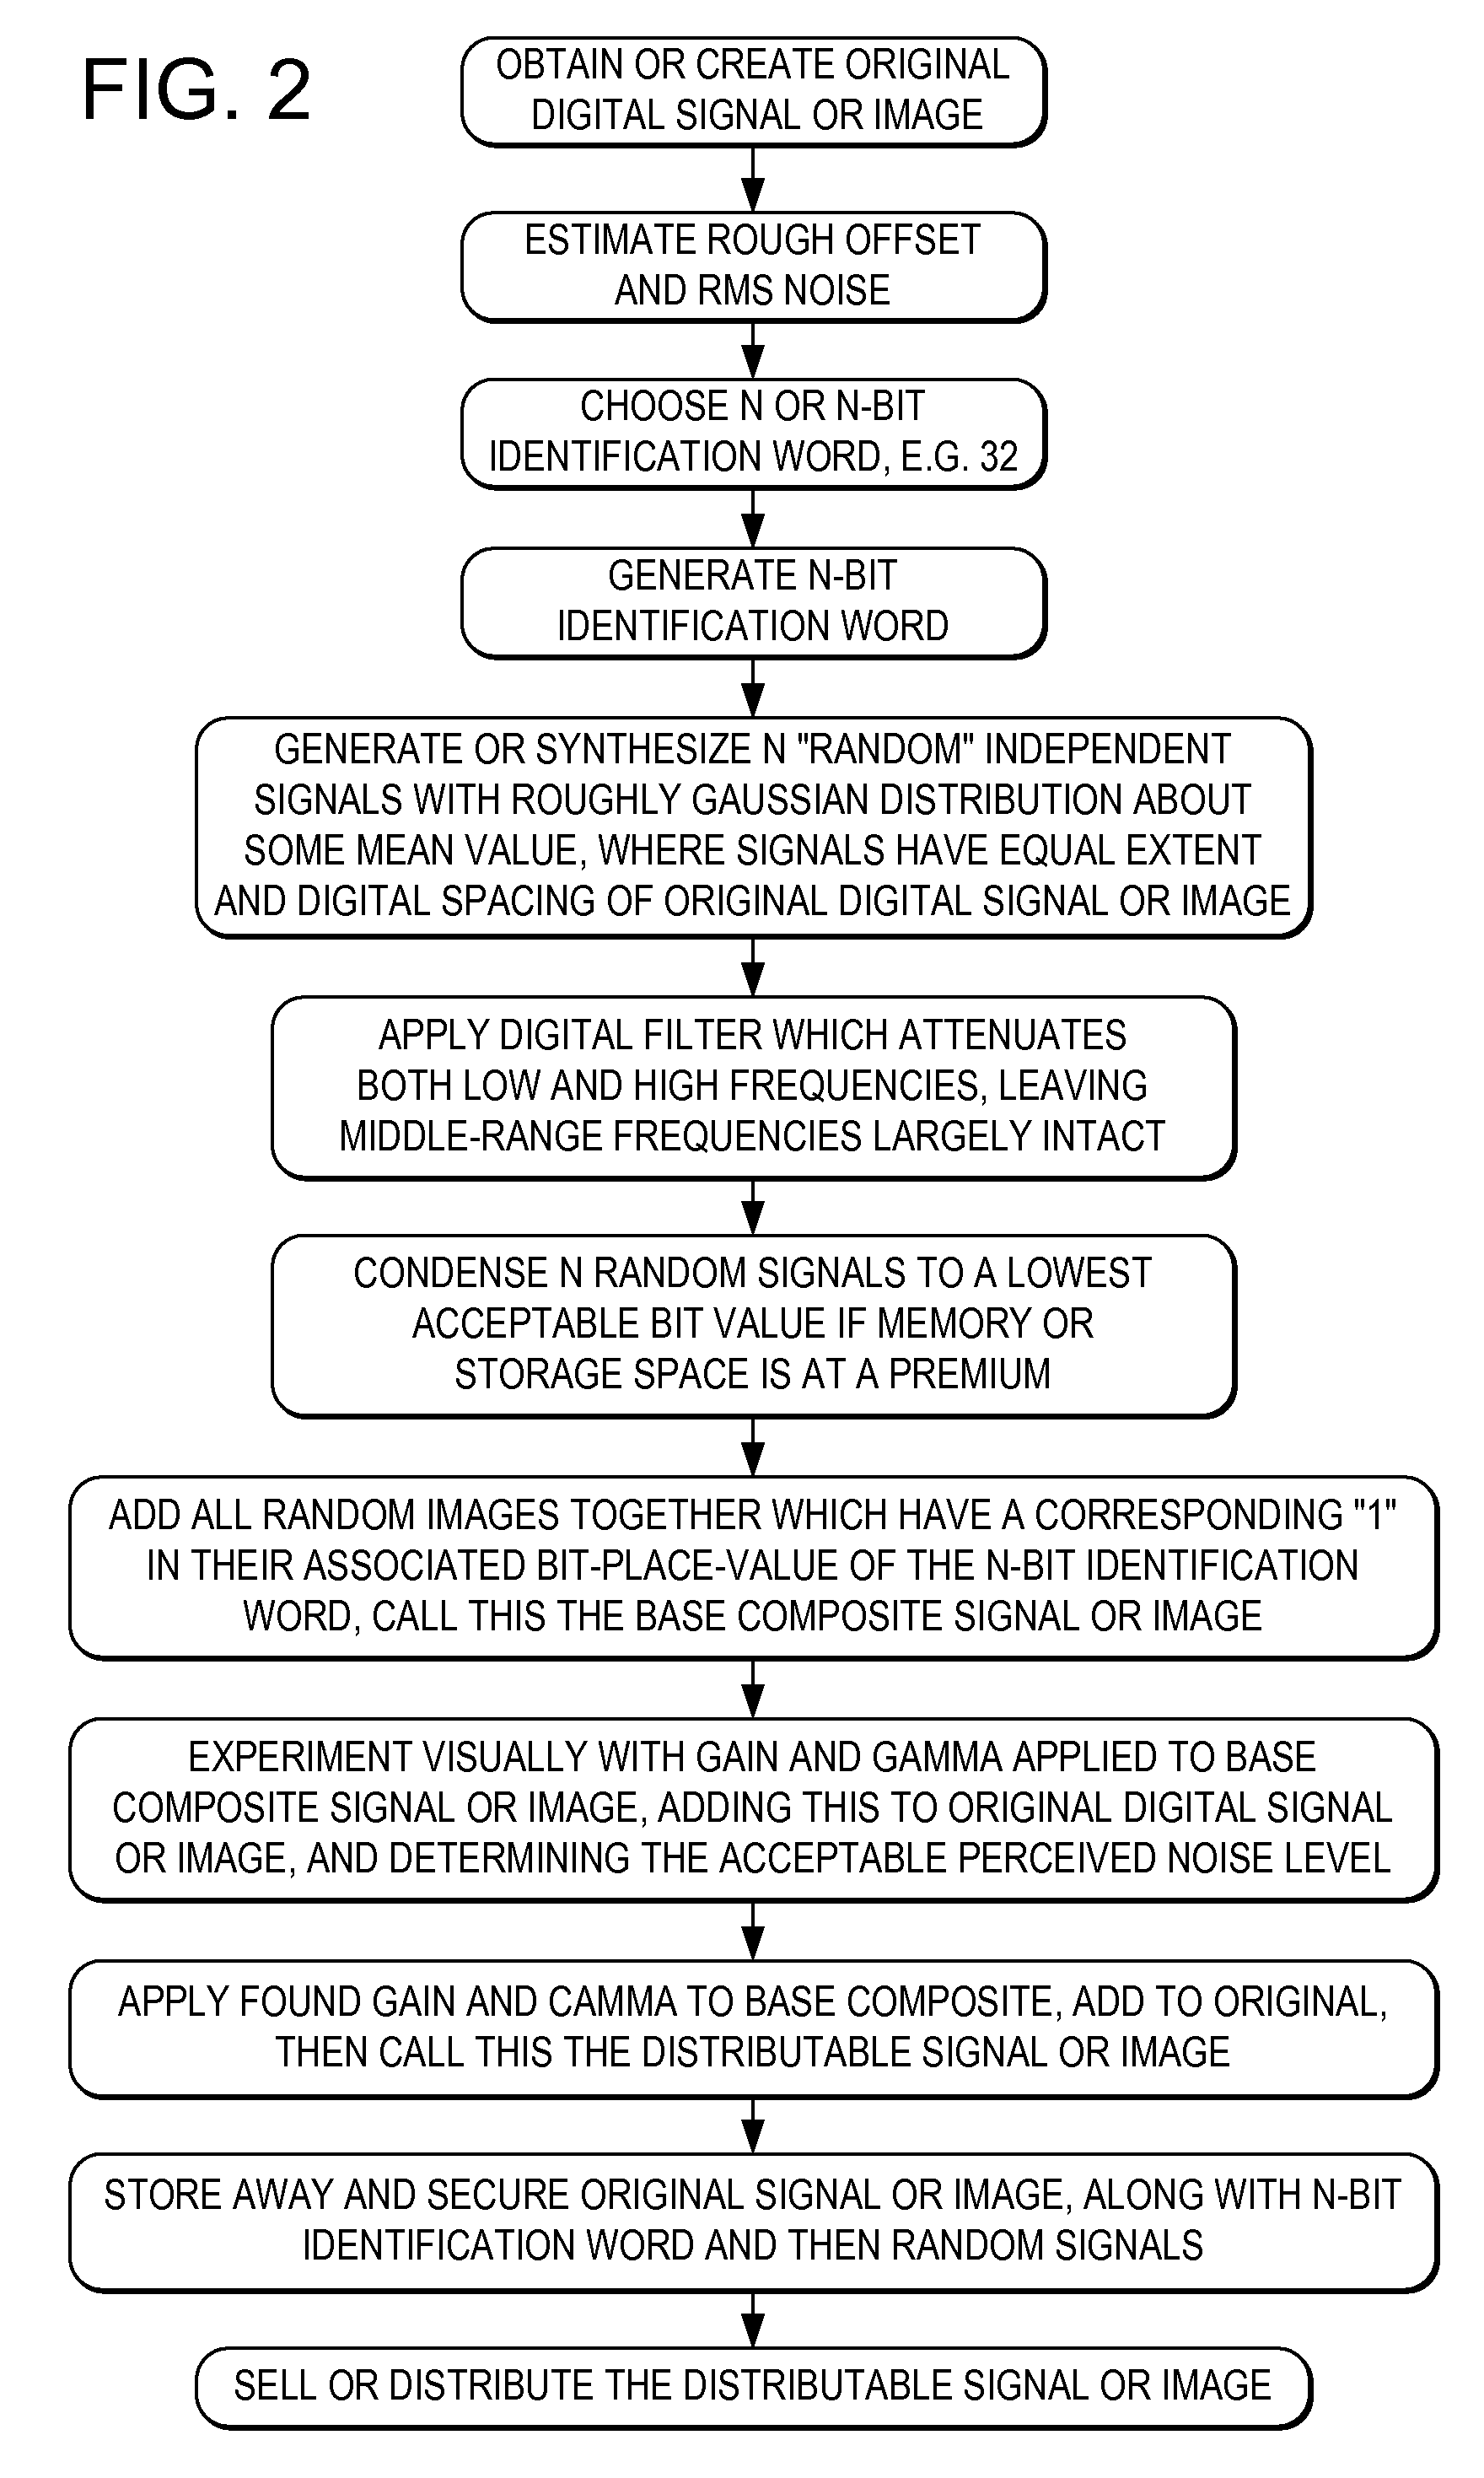
[0052] Imagine that we have taken a valuable picture of two heads of state at a cocktail party, pictures which are sure to earn some reasonable fee in the commercial market. We desire to sell this picture and ensure that it is not used in an unauthorized or uncompensated manner. This and the following steps are summarized in FIG. 2.

[0053] Assume the picture is transformed into a positive color print. We first scan this into a digitized form via a normal high quality black and white scanner with a typical photometric spectral response curve. (It is possible to get better ultimate signal to noise ratios by scanning in each of the three primary colors of the color image, but this nuance is not central to describing the basic process.)

[0054] Let us assume that the scanned image now becomes a 4000 by 4000 pixel monochrome digital image with a grey scale accuracy defined by 12-bit grey values or 4096 allowed levels. We will call this the “original digital image” realizing that this is t...


PUM


Abstract

The presently claimed invention relates generally to monitoring and / or filtering video or audio data. In one implementation a method is provided including: obtaining data representing video or audio; analyzing the data representing video or audio for an in-band signal, the in-band signal encoded in data representing video picture elements or in data representing audio elements; looking for out-of-band data conveyed with the data representing video or audio; restricting or allowing distribution of the data representing video or audio based at least in part on a result of the act of analyzing and a result of the act of looking. In some implementations the in-band signal includes steganographic encoding or digital watermarking. Of course, other implementations and embodiments are provided.

Description

RELATED APPLICATION DATA [0001] This application is a continuation of U.S. patent application Ser. No. 10 / 400,159, filed Mar. 25, 2003 (published as US 2004-00153363), which is a continuation of Ser. No. 09 / 441,819, filed Nov. 17, 1999 (now U.S. Pat. No. 6,539,095), which is a division of application Ser. No. 08 / 951,858, filed Oct. 16, 1997 (now U.S. Pat. No. 6,026,193), which is a continuation of application Ser. No. 08 / 436,134, filed May 8, 1995 (now U.S. Pat. No. 5,748,763), which is a continuation-in-part of application Ser. No. 08 / 327,426, filed Oct. 21, 1994 (now U.S. Pat. No. 5,768,426). The foregoing applications and patents are hereby incorporated herein by reference.FIELD OF THE INVENTION [0002] The present invention relates to signal processing, and more particularly relates to the processing of such signals to embed auxiliary data (e.g. identification or control data therein), and the subsequent extraction and use of such data. BACKGROUND AND SUMMARY OF THE INVENTION [00...

Claims


Application Information

Patent Timeline
IPC IPC(8): H04B1/66G06K9/00G06T1/00G07C9/00G07D7/00G07D7/12G07F7/08G07F7/10G07F7/12G07F17/16G10L19/00G11B20/00H04K1/00H04N1/00H04N1/32H04N5/913
CPCG06Q20/341H04N2201/328G06Q30/0283G06T1/005G06T1/0064G06T2201/0052G06T2201/0065G07C9/00079G07D7/0013G07D7/004G07F7/08G07F7/086G07F7/1008G07F7/1016G07F7/12G07F17/16G10L19/018G11B20/00086G11B20/00094G11B20/00115G11B20/00166G11B20/00181G11B20/0021G11B20/00884G11B20/00891G11B2020/10537H04B1/665H04K1/02H04N1/00005H04N1/00037H04N1/00079H04N1/32144H04N1/32154H04N1/3216H04N1/32208H04N1/32251H04N1/32288H04N5/913H04N9/8205H04N2005/91307H04N2005/91321H04N2005/91335H04N2005/91342H04N2201/3205H04N2201/3207H04N2201/3226H04N2201/3233H04N2201/327H04N2201/3271G06Q20/40145G07D7/0032G07C9/253
Inventor RHOADS, GEOFFREY B.
Owner DIGIMARC CORP
Learn More