System and method for facilitating interactive selection and presentation of datasets
Active Publication Date: 2008-06-19
R2 SOLUTIONS
View PDF2 Cites 6 Cited by
Summary
Abstract
Description
Claims
Application Information
AI Technical Summary
This helps you quickly interpret patents by identifying the three key elements:
Problems solved by technology
Method used
Benefits of technology
[0005]A system and method to facilitate interactive selection and presentation of datasets are described. An interactive data interface is presented to a user in a display window, said interactive data interface containing distribution of a dataset accessed by the user. A minimum range value and a maximum range value corr
Problems solved by technology
Such applications fail to provide an interactive visualization of a percentage of the dataset selected by the user-entered data ranges and also fail to show the relationship of the selection t
Method used
Image
Click on the blue label to locate the original text in one second.
Reading with bidirectional positioning of images and text.
Examples
Example
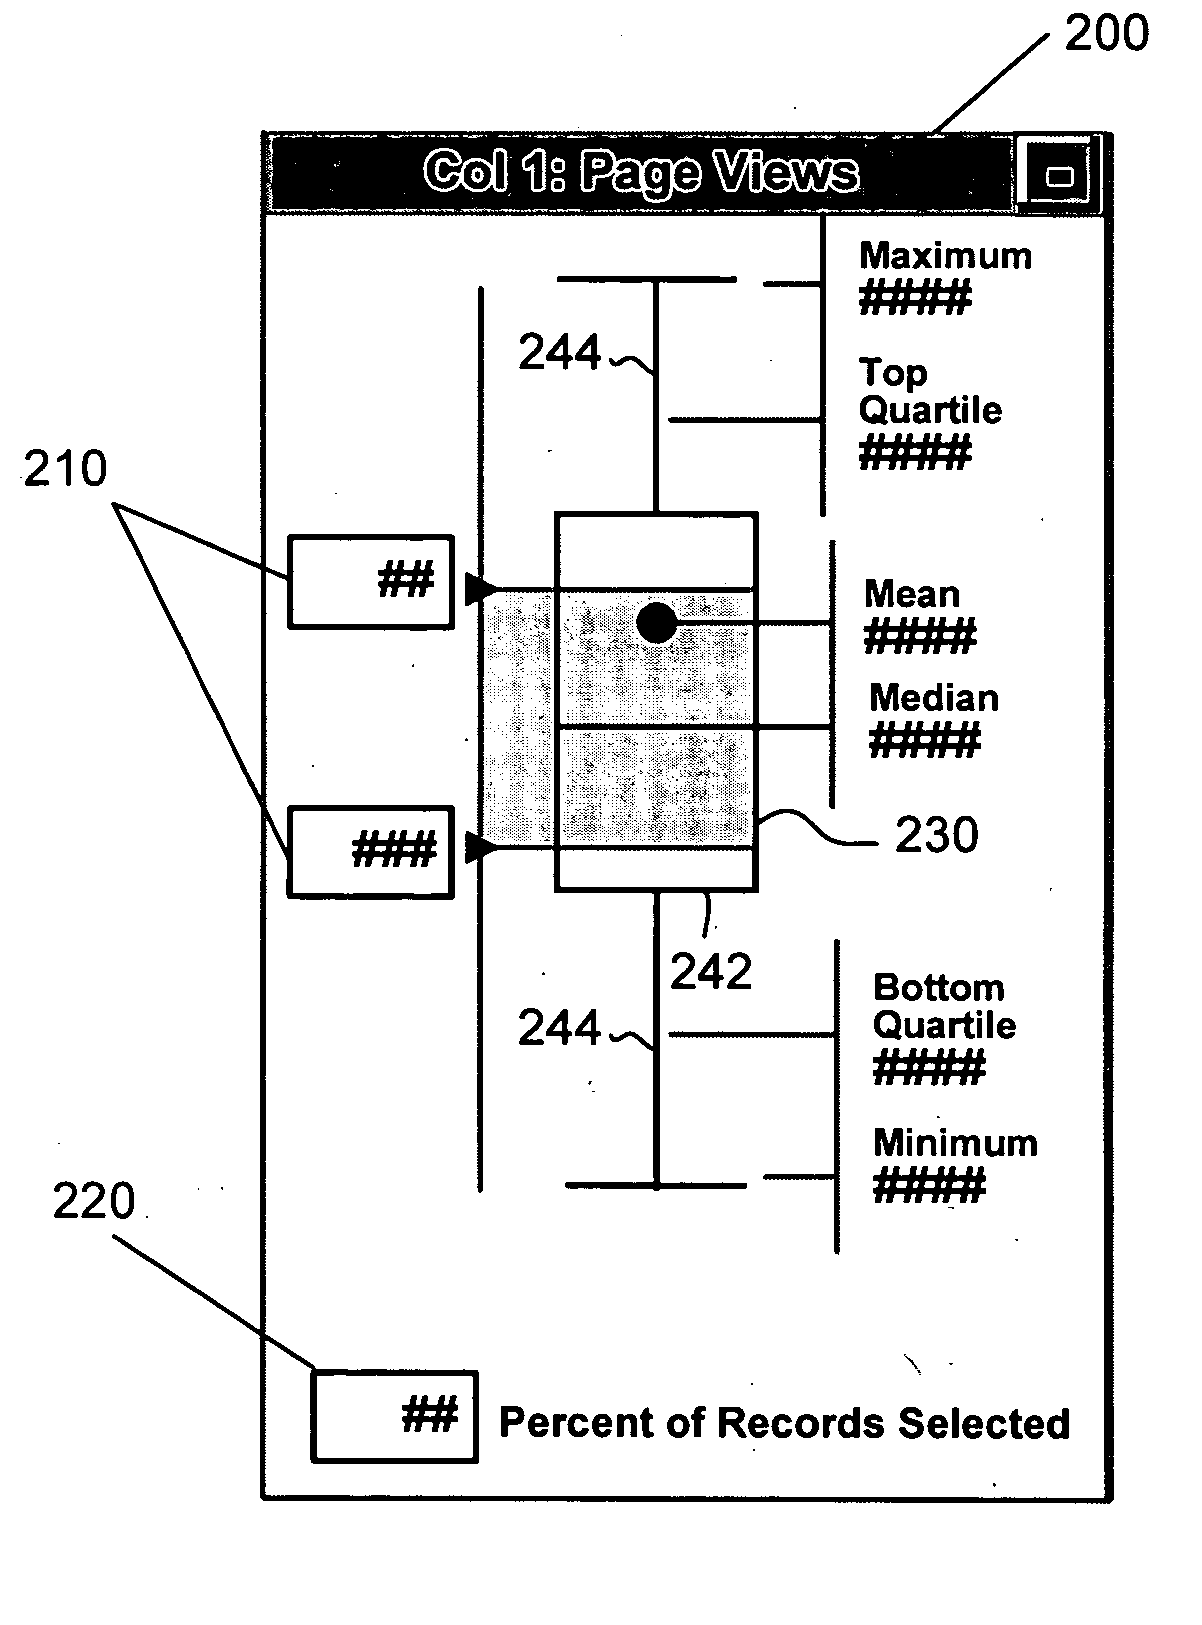
[0014]The field of descriptive statistics enables the compact representation of data by describing key metrics about an underlying dataset. The most common statistical measures include minimum, upper quartile, lower quartile, mean, median, and maximum measures of the dataset. These numbers can describe the skewness of a histogram, which displays the frequency of records at any given point along a continuous or ordinal range of data. A more compact representation of the histogram is a box-plot (also called a box-and-whisker plot). The box-plot represents where the middle 50% percent of the data by frequency lies on an ordinal scale. The boundaries of this box are thus the upper and lower quartiles. The median and mean of the box-plot are represented by either lines or dots. The minimum and maximum outliers of the data set are represented by lines parallel to the short sides of the box. These outliers are connected to the box by perpendicular lines. Since these outliers and their conn...
PUM
Abstract
A system and method to facilitate interactive selection and presentation of datasets are described. An interactive data interface is presented to a user in a display window, said interactive data interface containing distribution of a dataset accessed by the user. A minimum range value and a maximum range value corresponding to a data range within the dataset are received, the range values being input by the user into one or more interactive areas within the data interface. Finally, display of data within the data range is further facilitated within an overlay area of the data interface disposed over the distribution of the dataset.
Description
TECHNICAL FIELD[0001]The present invention relates generally to computer applications and, more particularly, to a system and method to facilitate interactive selection and presentation of datasets.BACKGROUND OF THE INVENTION[0002]The explosive growth of the Internet as a publication and interactive communication platform has created an electronic environment that is changing the way business is transacted. As the Internet becomes increasingly accessible around the world, visitors, such as, for example, consumers and / or customers, need efficient tools to navigate the Internet and to find content available on various websites.[0003]Internet entities, such as, for example, portals provide visitors an entrance and guide into the vast resources of the Internet, such as, for example, a range of search, email, news, shopping, chat, maps, finance, entertainment, and other content and services. In addition, users may connect to the portals either directly or through a network, such as the I...
Claims
Application Information
Patent Timeline
Application Date:The date an application was filed.
Publication Date:The date a patent or application was officially published.
First Publication Date:The earliest publication date of a patent with the same application number.
Issue Date:Publication date of the patent grant document.
PCT Entry Date:The Entry date of PCT National Phase.
Estimated Expiry Date:The statutory expiry date of a patent right according to the Patent Law, and it is the longest term of protection that the patent right can achieve without the termination of the patent right due to other reasons(Term extension factor has been taken into account ).
Invalid Date:Actual expiry date is based on effective date or publication date of legal transaction data of invalid patent.