Performing 3-D Scatterer Imaging From 2-D Seismic Data

a scatterer imaging and seismic data technology, applied in the field of seismic exploration, can solve the problems of not being able to provide reliable knowledge about the unpredictable structure of the lines, and not being generally suited to 3-d seismic migration imaging

Inactive Publication Date: 2008-08-14
LANDMARK GRAPHICS
View PDF13 Cites 11 Cited by
  • Summary
  • Abstract
  • Description
  • Claims
  • Application Information

AI Technical Summary

Benefits of technology

[0017]In one embodiment, searching for coherent diffraction arrivals may comprise computing a measure of coherence along predicted trajectories associated with the respective hypothetical diffractor location. In another embodiment, the searching may comprise first computing a summation over a presumed curve with the 2-D seismic data, followed by computing a summation over the presumed curve a second time with a randomized version of the 2-D seismic data, and then performing a comparison of the relative amplitudes of the two calculations to automatically select coherent diffraction arrivals. In yet another embodiment, the searching may comprise computing a simple weighted summation along possible diffraction sur

Problems solved by technology

However, this acquisition has interline spacing measured in kilometers, and thus is not generally suited to 3-D seismic migration imaging.
This does not provide reliable knowledge about unpredictable st

Method used


Image

  • Performing 3-D Scatterer Imaging From 2-D Seismic Data
  • Performing 3-D Scatterer Imaging From 2-D Seismic Data
  • Performing 3-D Scatterer Imaging From 2-D Seismic Data

Examples


Embodiment Construction

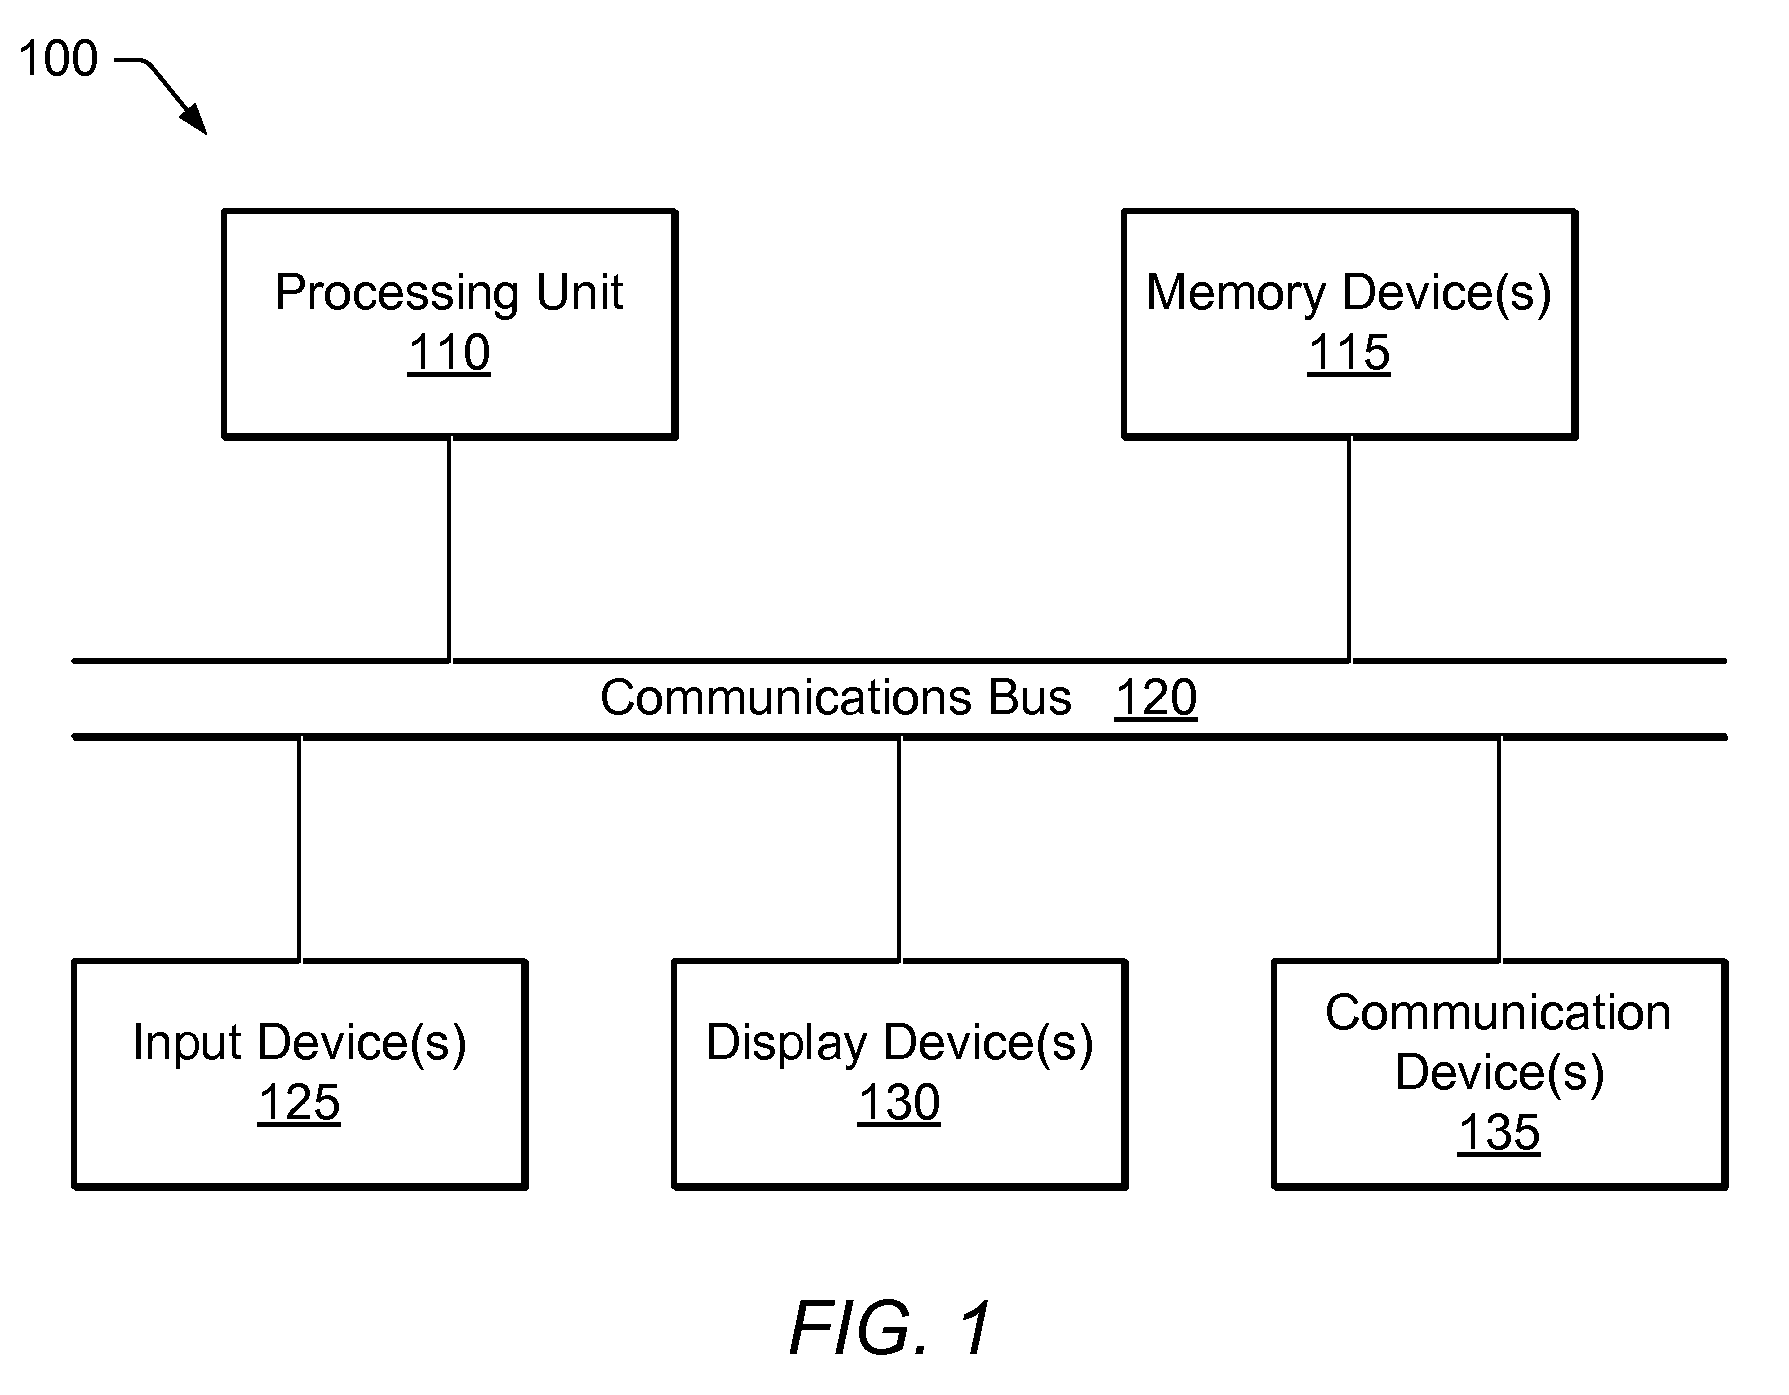
FIG. 1—Computer-Based Analysis System

[0030]FIG. 1 illustrates a system 100 (such as a computer system) for analyzing seismic data according to one set of embodiments of the invention. System 100 may include a processing unit 110, a collection of memory devices 115, a communication bus 120, a set of input devices 125, and one or more display devices 130. The collection of memory devices 115 may include any of various forms of memory media and memory access devices. For example, memory devices 115 may include semiconductor RAM and ROM devices as well as mass storage devices such as CD-ROM drives, magnetic disk drives, magnetic tape drives, storage area networks (SANs), etc.

[0031]Processing unit 110 is configured to read and execute program instructions, e.g., program instructions provided on a memory medium such as a set of one or more CD-ROMs, and loaded into semiconductor memory at execution time. Processing unit 110 may couple to memory devices 115 through communication bus 120 (or...


PUM


Abstract

A method for analyzing seismic data from a formation. The method may first receive two-dimensional (2-D) seismic data of a formation comprising a number of individual seismic lines acquired over an exploration area and having a large interline spacing. The 2-D seismic data may then be preprocessed to enhance diffracted energy. For each respective hypothetical diffractor location, the method may then search for coherent diffraction arrivals on nearby 2-D seismic lines consistent with the respective hypothetical diffractor location. The method may then store information regarding identified diffractor locations. The method may then create a map based on the identified diffractor locations, wherein the map illustrates areas of high diffraction. The map may then be displayed on a display, wherein the map is useable to assess the formation.

Description

FIELD OF THE INVENTION[0001]The present invention generally relates to seismic exploration, and more particularly to performing 3-D migration to image between coarsely spaced 2-D seismic data lines.DESCRIPTION OF THE RELATED ART[0002]Seismic exploration involves the study of underground formations and structures. In seismic exploration, one or more sources of seismic energy emit waves into a region of interest, such as a formation. These waves enter the formation and may be scattered, e.g., by reflection or refraction. One or more receivers sample or measure the reflected waves, and the resultant data are recorded. The recorded samples may be referred to as seismic data or “seismic traces”. The seismic data contain information regarding the geological structure and properties of the region being explored. The seismic data may be analyzed to extract details of the structure and properties of the region of the earth being explored.[0003]In general, the purpose of seismic exploration i...

Claims


Application Information

Patent Timeline
IPC IPC(8): G01V1/34
CPCG01V1/288
Inventor LEVIN, STEWART ARTHUR
Owner LANDMARK GRAPHICS
Why Eureka
Try Eureka