System and method for graphically displaying energy consumption and savings

Inactive Publication Date: 2008-09-18
LUTRON TECH CO LLC
View PDF11 Cites 178 Cited by
  • Summary
  • Abstract
  • Description
  • Claims
  • Application Information

AI Technical Summary

Problems solved by technology

Further, as global communications converge with everyday and common activities and devices, the desire for information of all kinds similarly increases, for example, the desire for information representing energy consumption also increases.
Fuel and energy consumption occurs indoors from various so

Method used


Image

  • System and method for graphically displaying energy consumption and savings
  • System and method for graphically displaying energy consumption and savings
  • System and method for graphically displaying energy consumption and savings

Examples


first embodiment

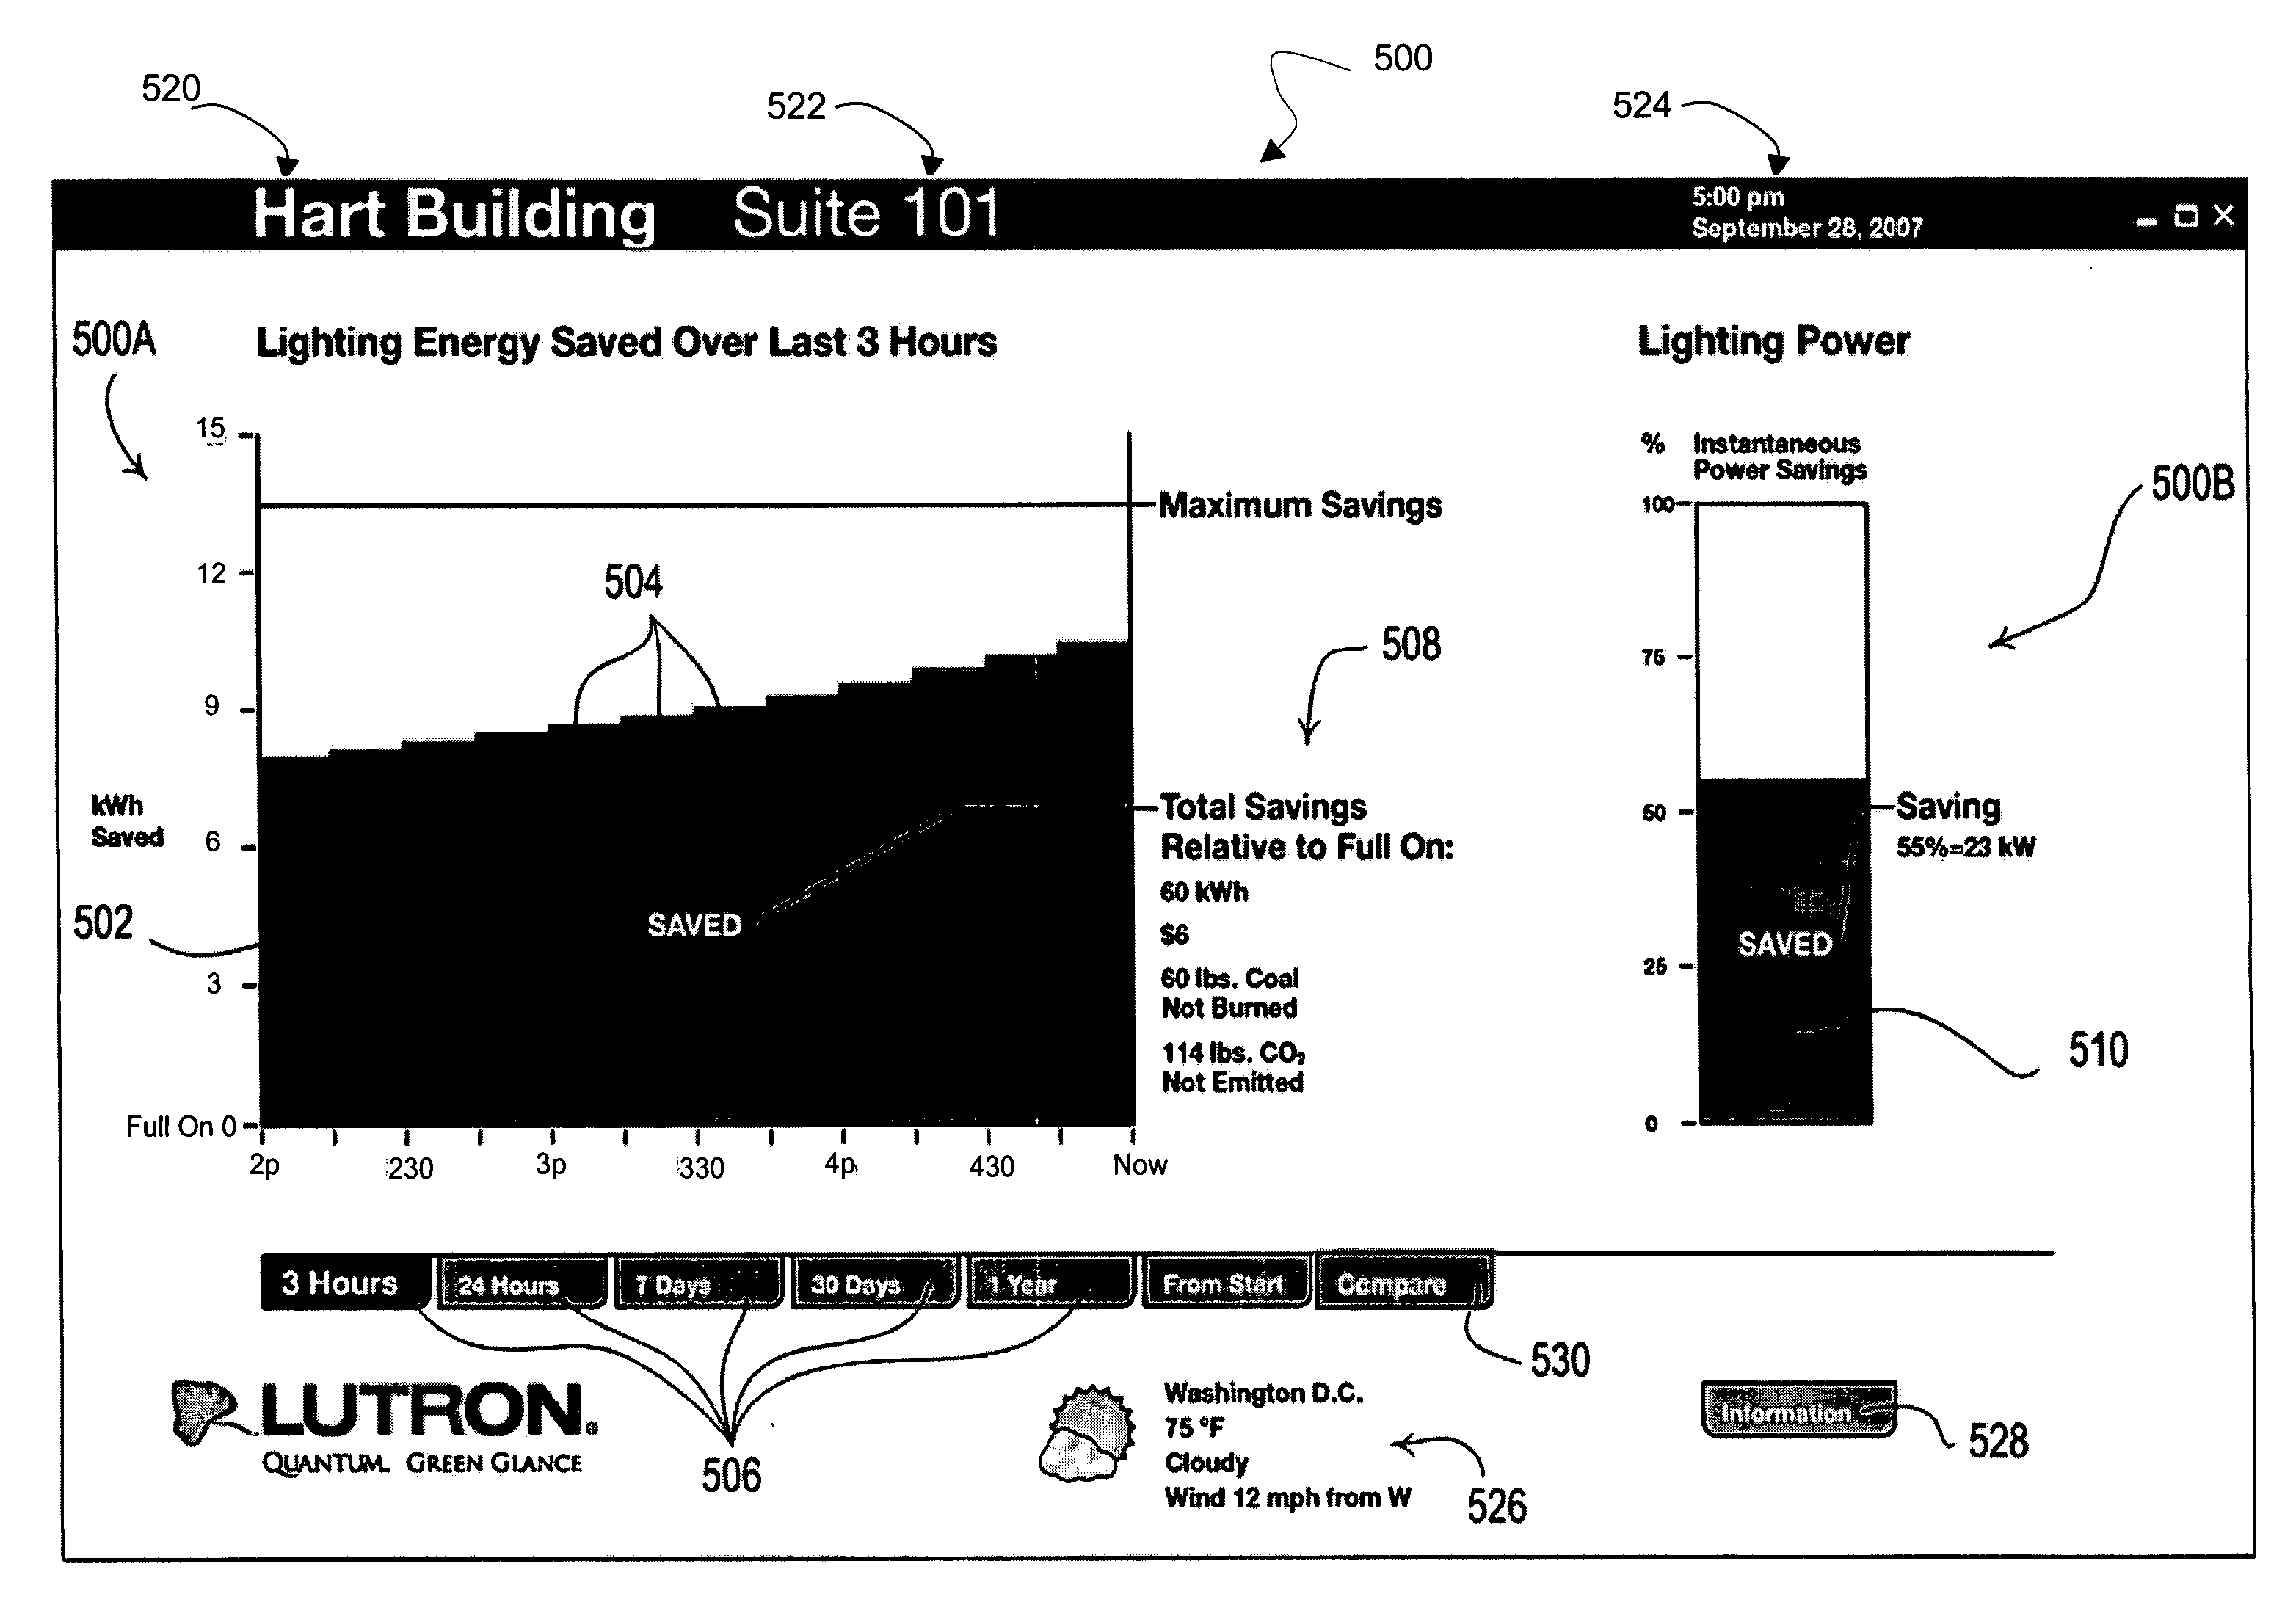
[0064]FIGS. 5A-5D represent an example of a display screen 500 that is provided to users of the system 200 over time in accordance with the present invention. As shown in FIGS. 5A-5D, the display screen 500 includes various components that are extremely intuitive, and provide detailed information that is easily viewed and understood without requiring more than a brief glance from the viewer. The data that is represented on the display screen 500 is retrieved from the database 163 (FIG. 3) and in accordance with the modules 402-440 (of FIG. 4).

[0065]The display screen 500 includes a historical energy savings display portion 500A and an instantaneous energy savings display portion 500B. On the historical energy saving display portion 500A, the amount of lighting energy saved in comparison to the maximum possible energy savings across various time periods is displayed in a graphical plot 502. Specifically, in FIG. 5A, the historical energy savings (in kWh) is displayed for the last thr...

third embodiment

[0092]FIG. 11 shows a display screen 1100 according to the present invention. The display screen 1100 includes additional graphical screen controls in a device selection section 1113 in accordance with a preferred embodiment. Selectable device options are provided in the device selection section 1113 for a user to select plug-in devices, HVAC, lighting and the total combination thereof. In the example shown in FIG. 11, the twenty-four hour period of time is selected in the time selection section 1014 and the total electrical power is selected in the device selection section 1113, thereby representing the total electrical power consumed and saved in the building over the past day.

[0093]Accordingly, the display screens 500, 1000, 1100 provide intuitive and useful information representing energy and resource consumption and savings over time and in respective locations. Although many of the descriptions and examples provided herein refer to graphical screen controls that are selectable...


PUM


Abstract

A system for displaying an electronic representation of the consumption of a resource by a device comprises a communication network, a database, and visual display. The database is accessible by an information processor of the network and stores information including a maximum rated amount of the resource consumed by the at least one device and the actual amount of the resource consumed by the at least one device. The visual display provides an electronic representation of the resource, the amount of the resource consumed by the at least one device and the amount of the resource saved as a function of the electronic device information, wherein the visual display presents the electronic representation in a graphical format. The graphical format of the electronic representation is a graph formatted with a range of values and an indicator of an indicated value in the range. The range of values is operable to dynamically change when the consumption of the resource by the at least one device exceeds the maximum rated amount of the resource consumed by the at least one device.

Description

BACKGROUND OF THE INVENTION[0001]1. Field of the Invention[0002]The present invention relates generally to graphical displays, and, more particularly, to graphically displaying energy consumption and savings at selected locations.[0003]2. Description of the Related Art[0004]Increasingly, awareness of the consumption of energy and resources is provided in mainstream society and politics. The so-called “green” movement is no longer considered on the fringe or outside of mainstream society, as concerns of global warming and other deleterious planetary conditions resulting from excessive energy and resource consumption are on the rise. Further, as global communications converge with everyday and common activities and devices, the desire for information of all kinds similarly increases, for example, the desire for information representing energy consumption also increases. As awareness and concerns about environmental resource consumption and waste, particularly as it affects global warm...

Claims


Application Information

Patent Timeline
IPC IPC(8): G06F3/048
CPCH02J13/001H05B37/0245Y04S20/246Y02B70/3283Y04S10/40Y02B20/40H02J13/00001H05B47/175Y02B70/30
Inventor ROWBOTTOM, IANJACOB, JOE SURESHJACOBY, ELLIOT G.SPIRA, JOEL J.
Owner LUTRON TECH CO LLC
Why Eureka
Try Eureka