Method for superimposing statistical information on tabular data
- Summary
- Abstract
- Description
- Claims
- Application Information
AI Technical Summary
Benefits of technology
Problems solved by technology
Method used
Image
Examples
example 3
Constructing Relative Frequency and Percentage Frequency Tables
[0047]Using the data from Example 2 above, a frequency table can be constructed giving the relative frequency and percentage frequency of each interval of battery life the table would appear similar as that in Table 3.
TABLE 3Life of AA batteries, in minutesFrequencyRelativePercentBattery life, minutes (x)(f)frequencyfrequency360-36920.077370-37930.1010380-38950.1717390-39970.2323400-40950.1717410-41940.1313420-42930.1010430-43910.033Total301.00100
An user / analyst reviewing and utilizing these data could now say that:
[0048]7% of AA batteries have a life of from 360 minutes up to but less than 370 minutes, and that the probability of any randomly selected AA battery having a life in this range is approximately 0.07.
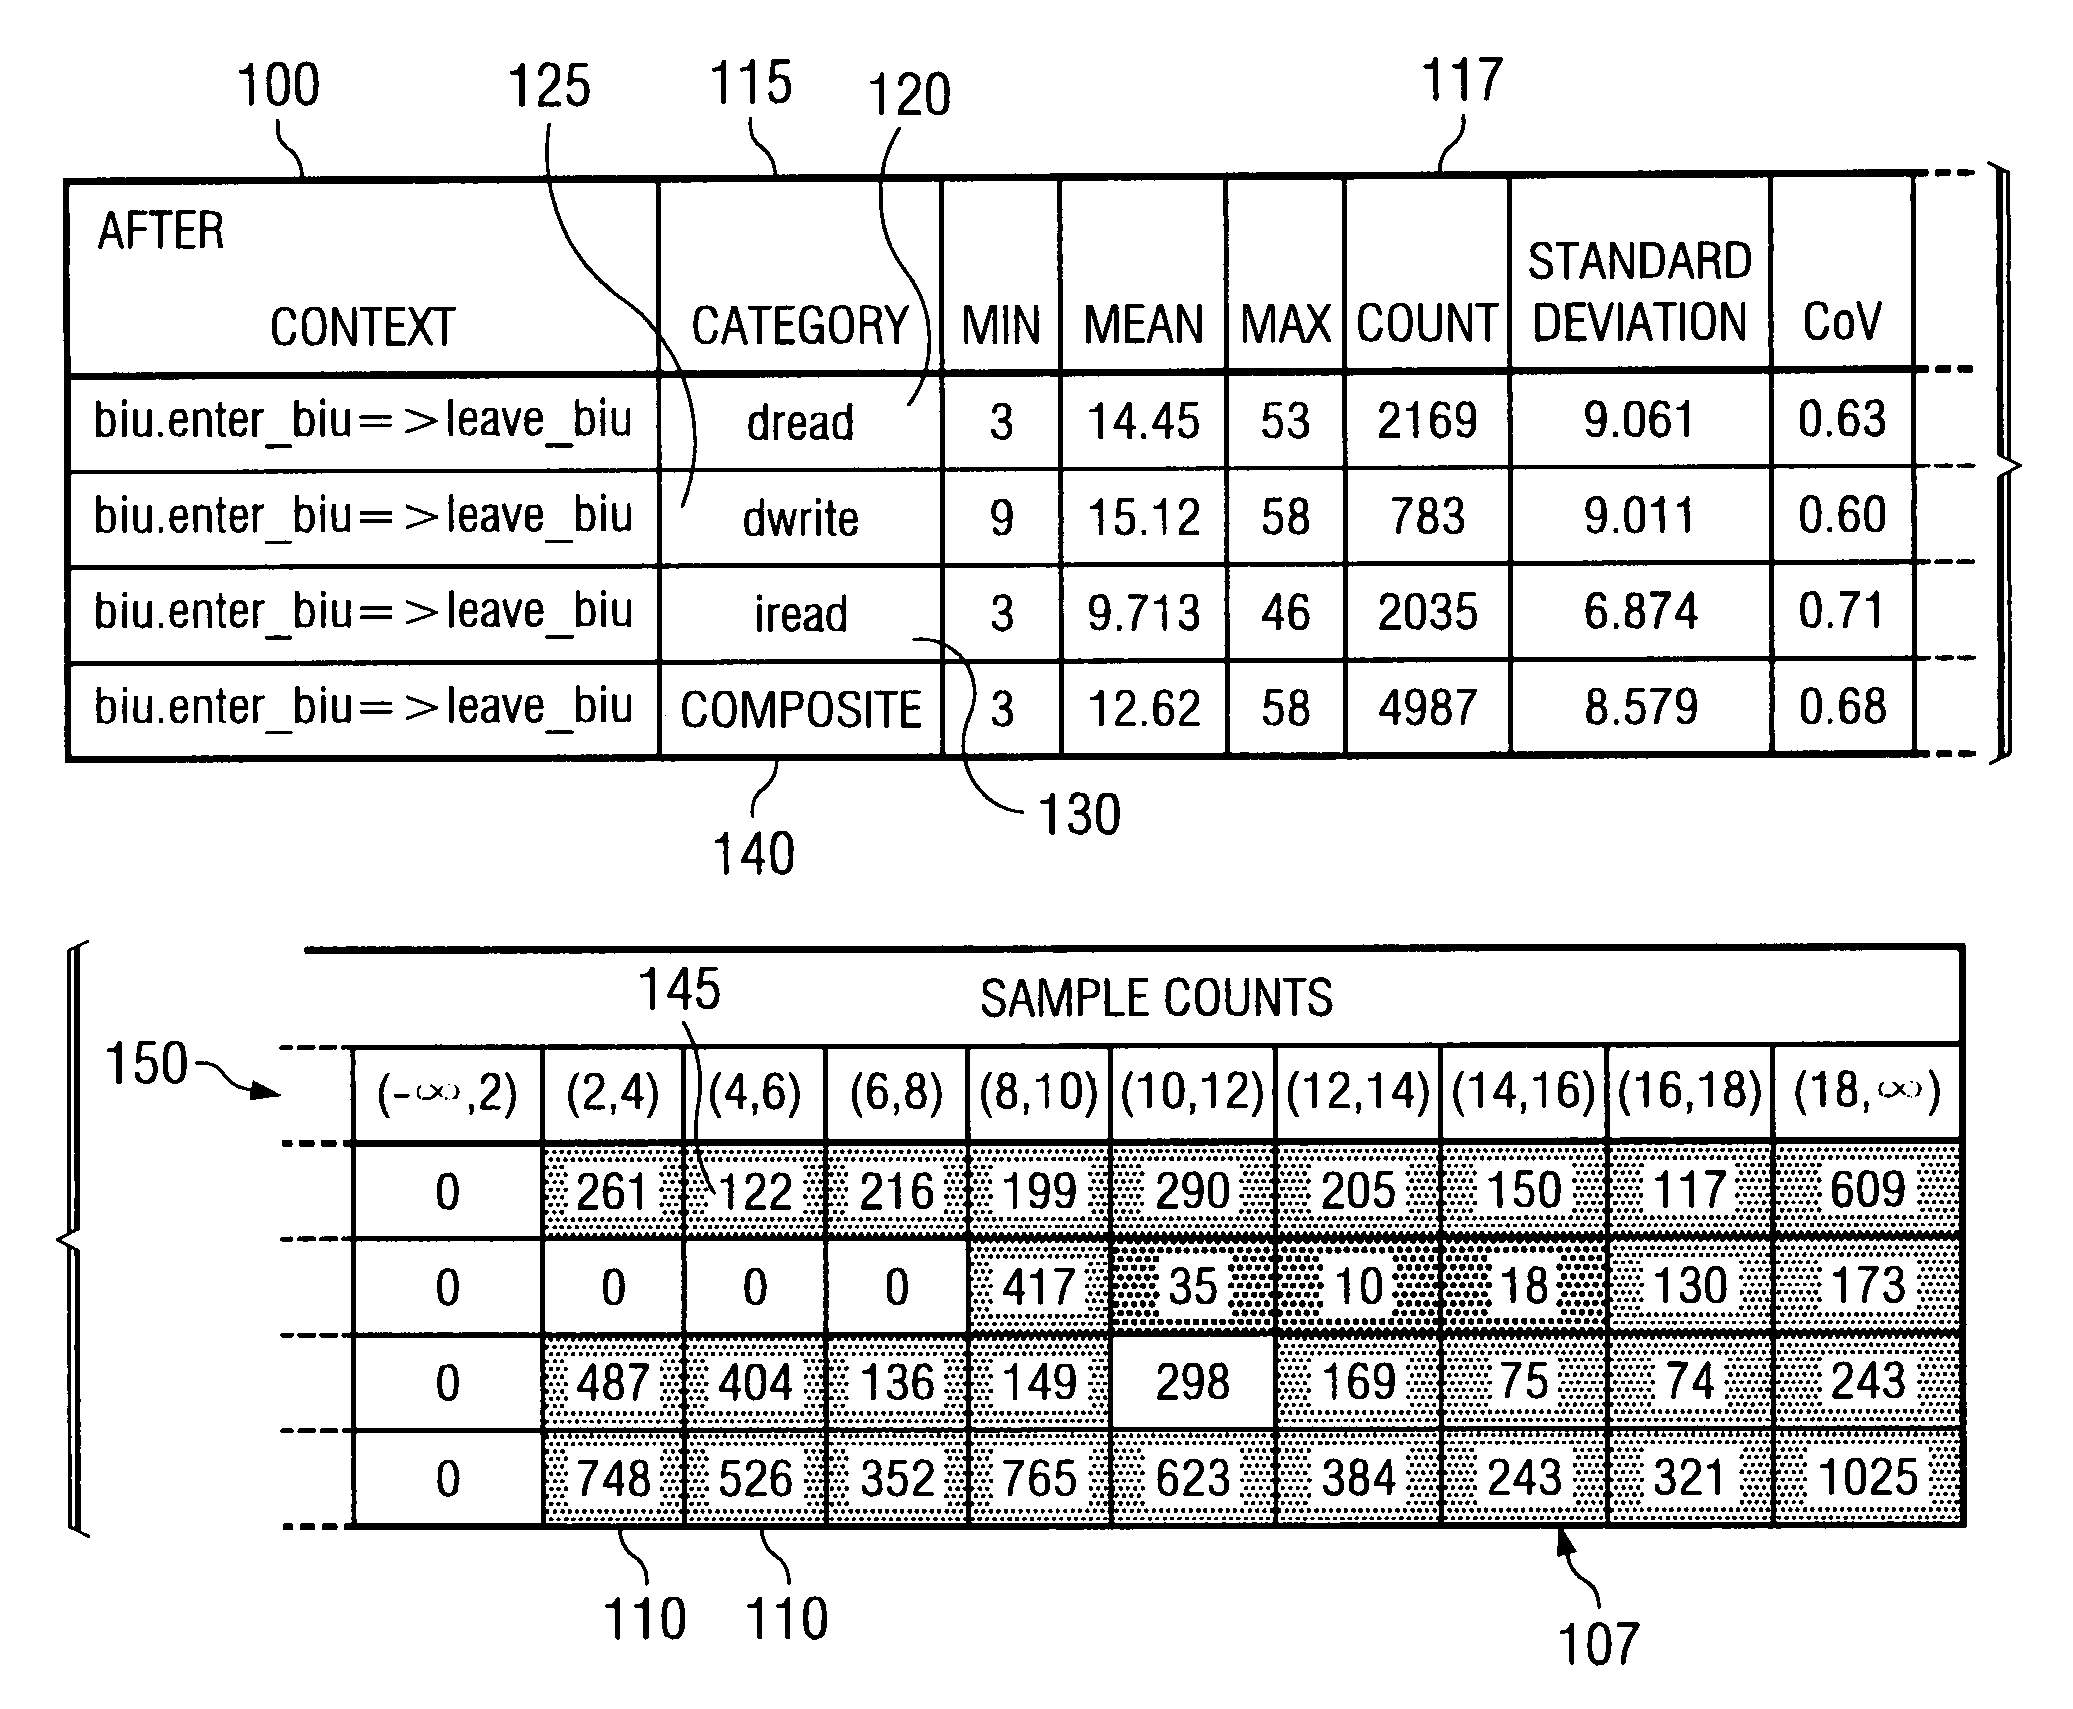
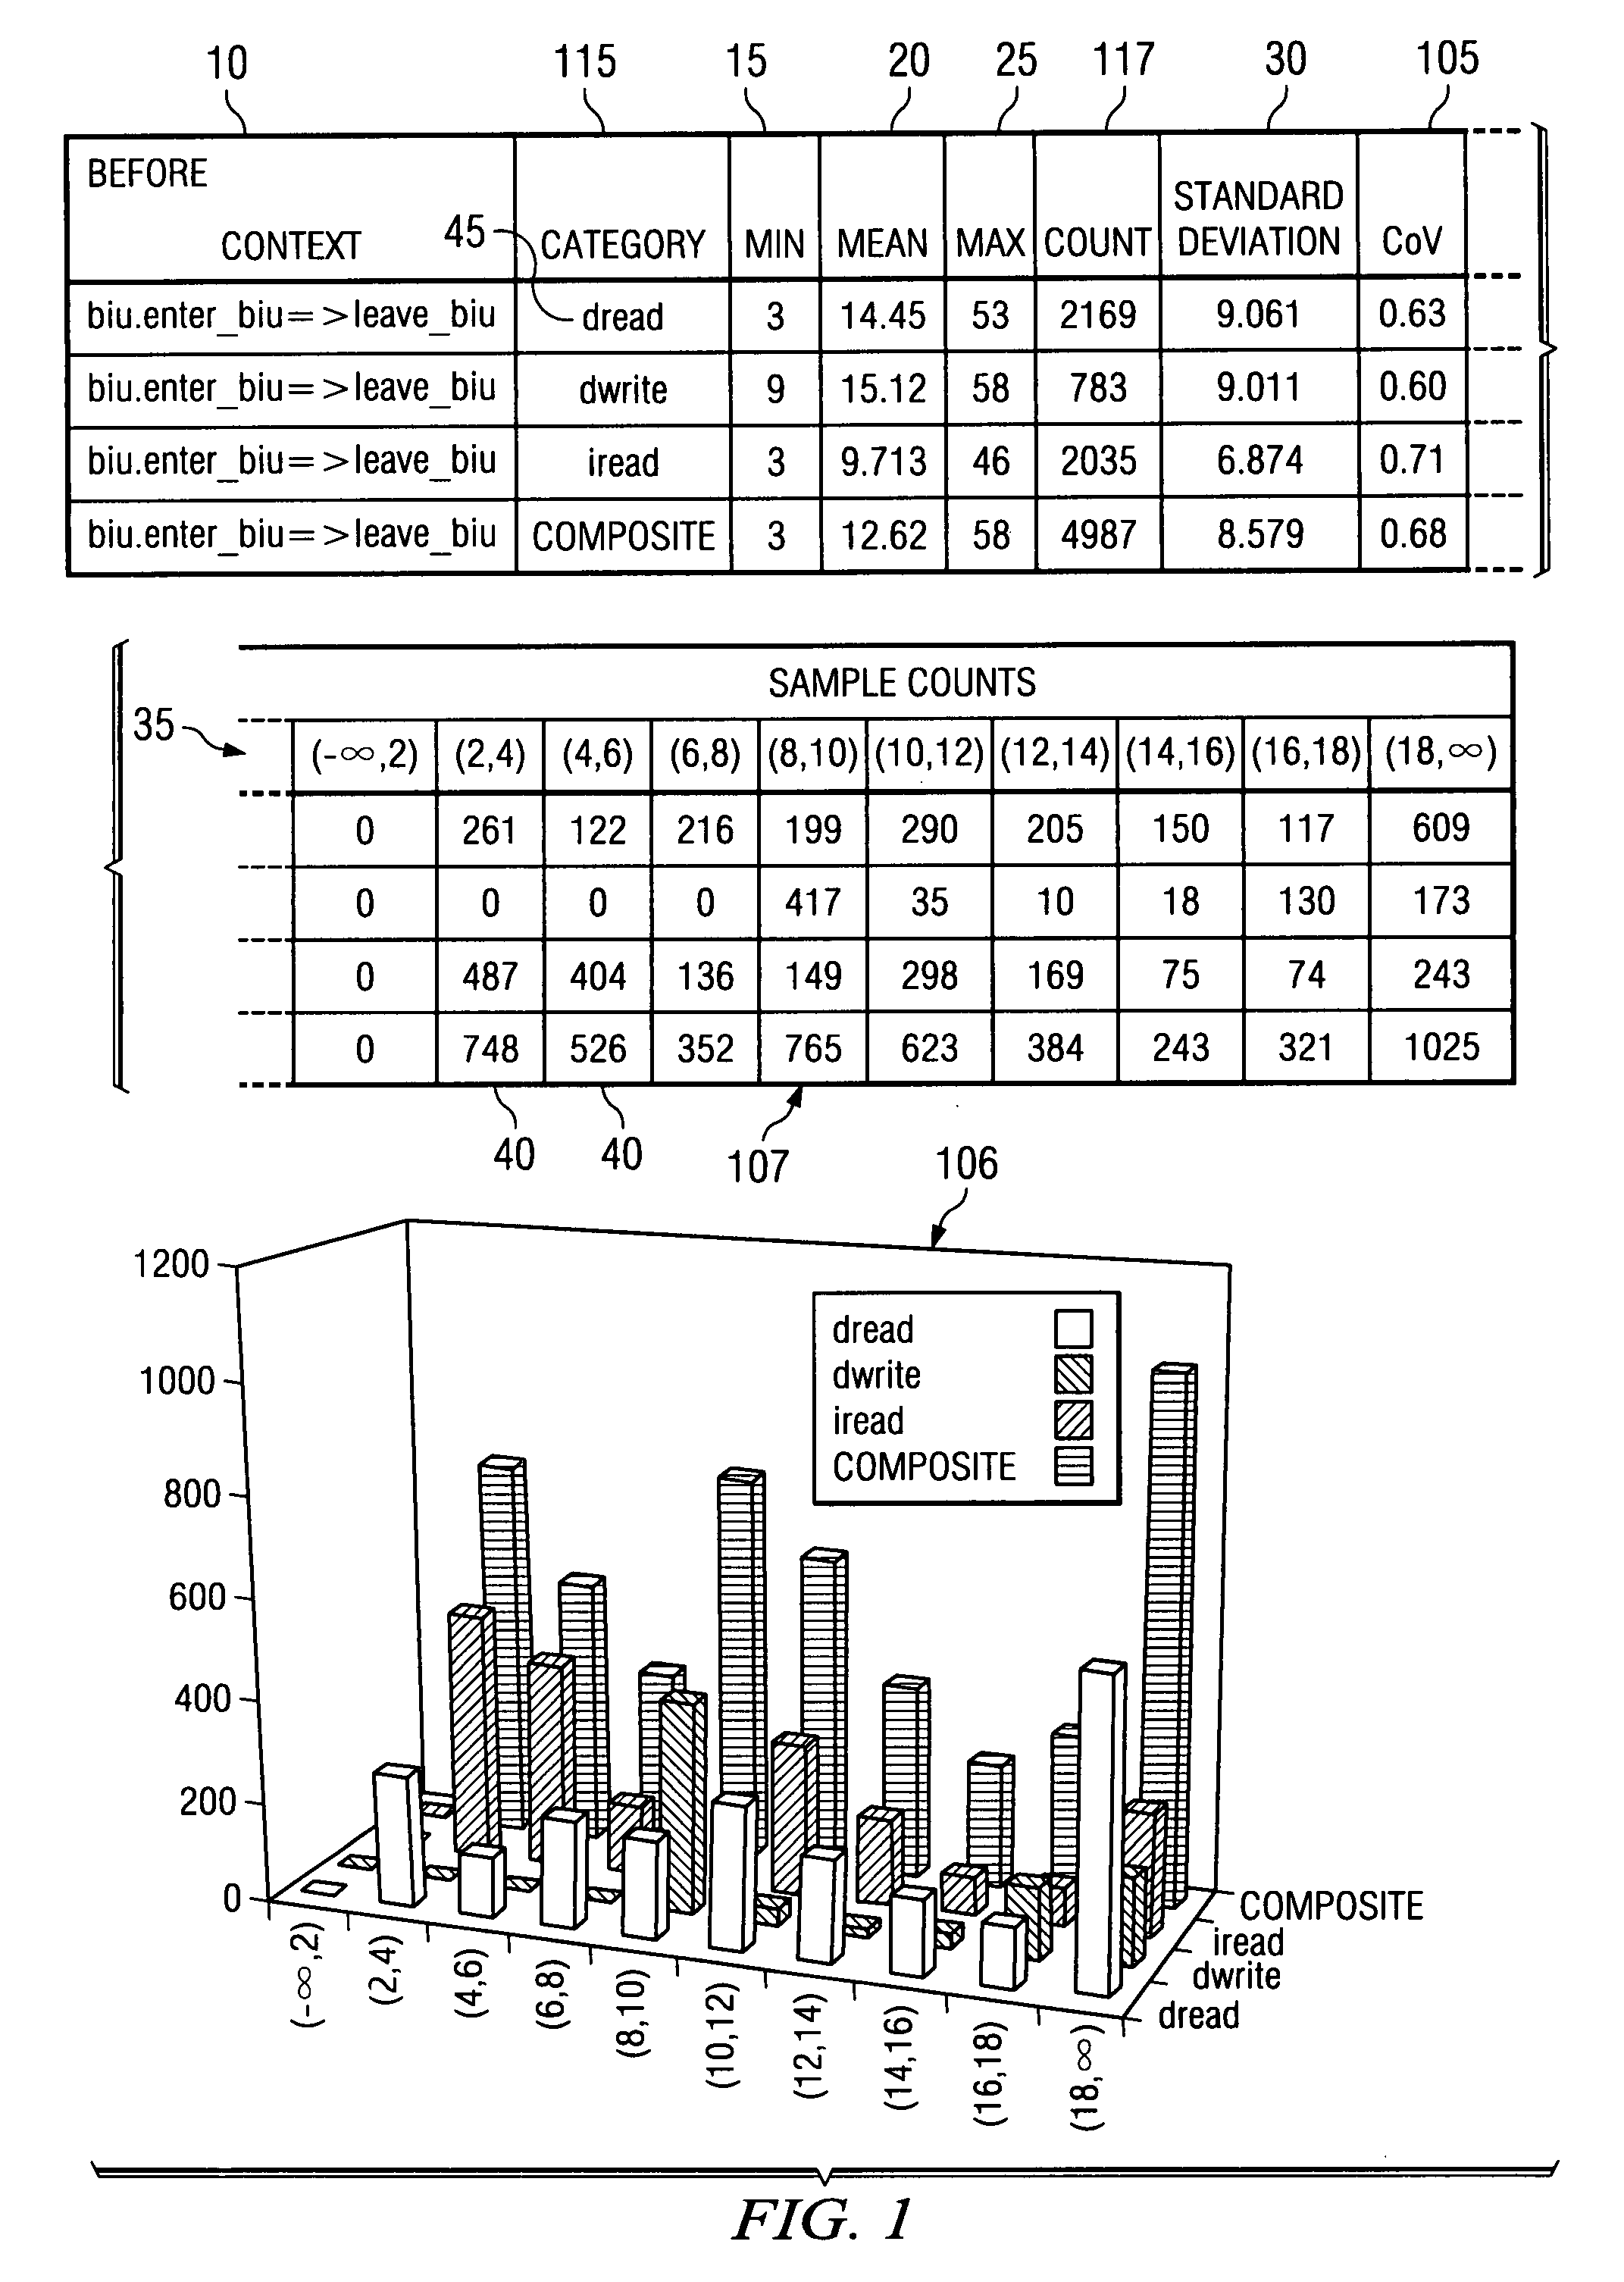
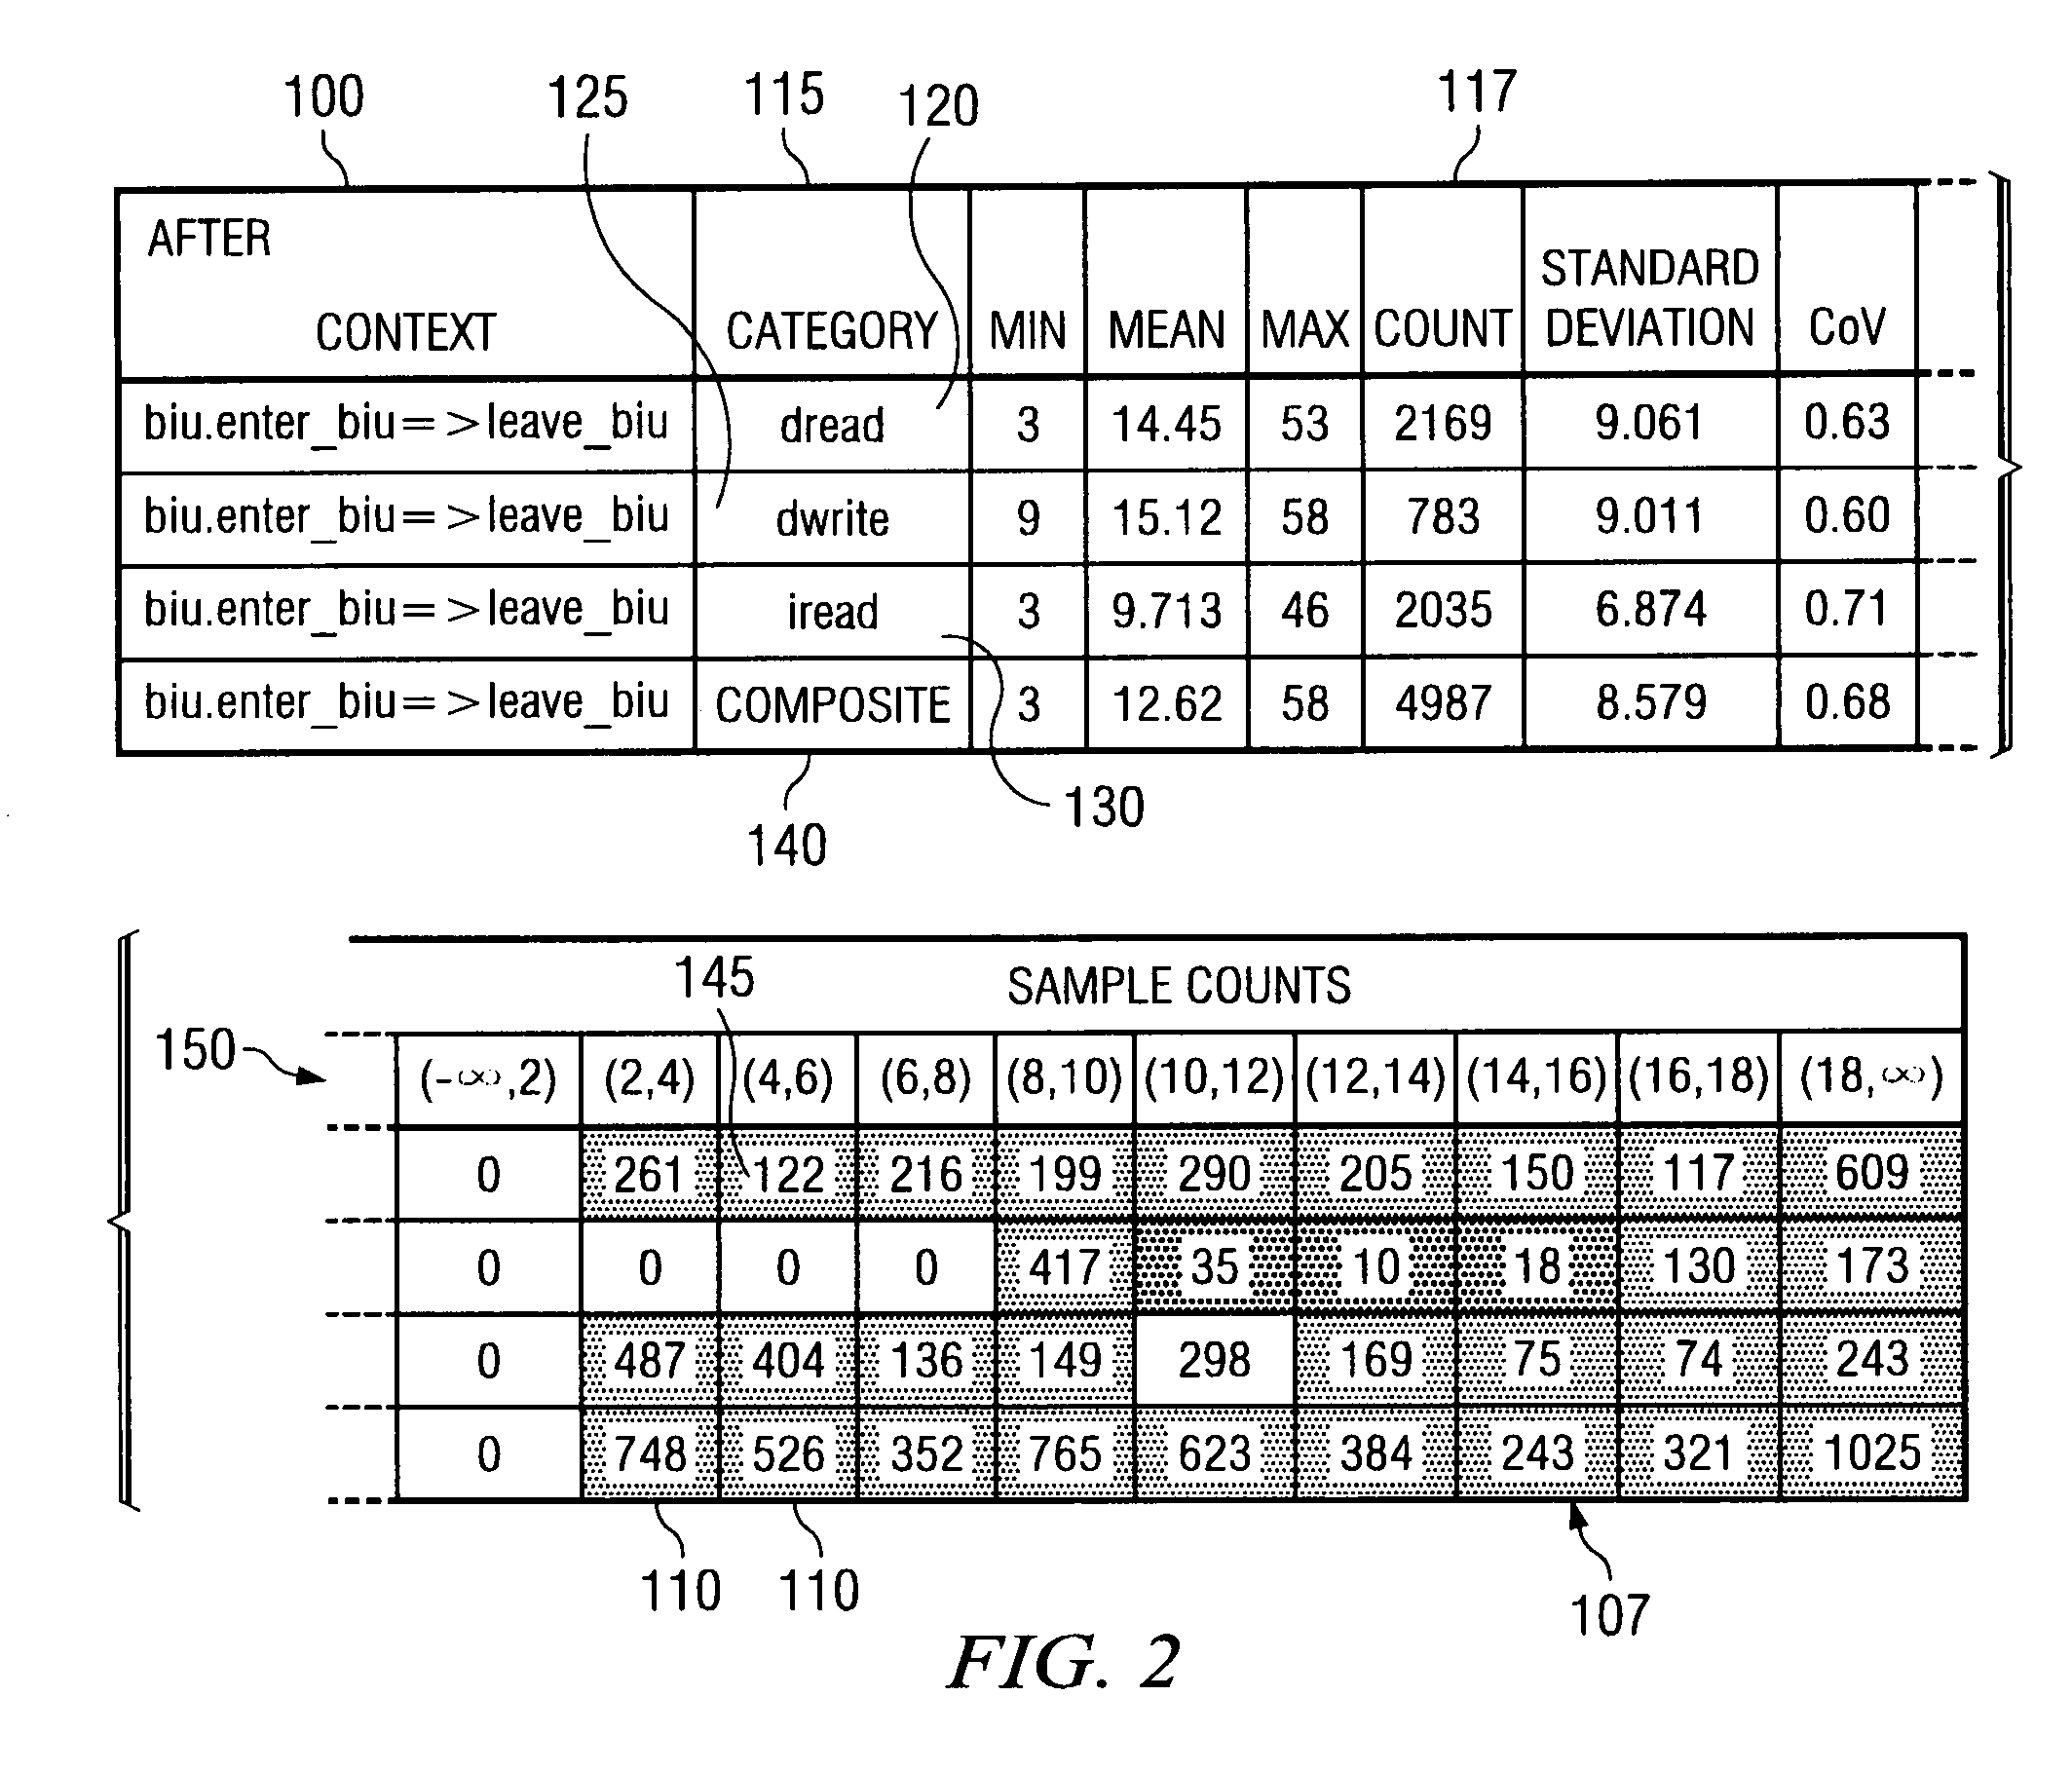
[0049]After data has been collected, the data as presented in Table 3 above can be used by the method of the present invention to compactly and simultaneously display all information using only one table comprisi...
PUM
 Abstract
Description
Claims
Application Information
 - R&D
- Intellectual Property
- Life Sciences
- Materials
- Tech Scout
- Unparalleled Data Quality
- Higher Quality Content
- 60% Fewer Hallucinations
Browse by: Latest US Patents, China's latest patents, Technical Efficacy Thesaurus, Application Domain, Technology Topic, Popular Technical Reports.
© 2025 PatSnap. All rights reserved.Legal|Privacy policy|Modern Slavery Act Transparency Statement|Sitemap|About US| Contact US: help@patsnap.com


